Introduction
In the fast-evolving glass manufacturing industry, smart factories rely on sophisticated software and algorithms to automate end-to-end production scheduling. Yet for all this automation, most factories still struggle with a fundamental problem: critical operational data trapped inside systems is invisible to managers and frontline teams. This lack of visibility leads to unplanned downtime, production bottlenecks, delayed orders, and wasted material.
Yinrui Software addresses this challenge head-on with a complete suite of production management dashboards and ERP visualization dashboards purpose-built for glass fabrication. These real-time tools turn opaque system data into clear, actionable insights, empowering teams to monitor equipment, track orders, optimize workflows, and manage inventory—all from a single, intuitive interface.
Part 1: Production Management Dashboards for End-to-End Shop Floor Control
Our glass production management dashboard suite covers every stage of the manufacturing process, from raw glass receiving to finished product warehousing. Below are the core modules driving operational excellence:
- Workshop Master Dashboard
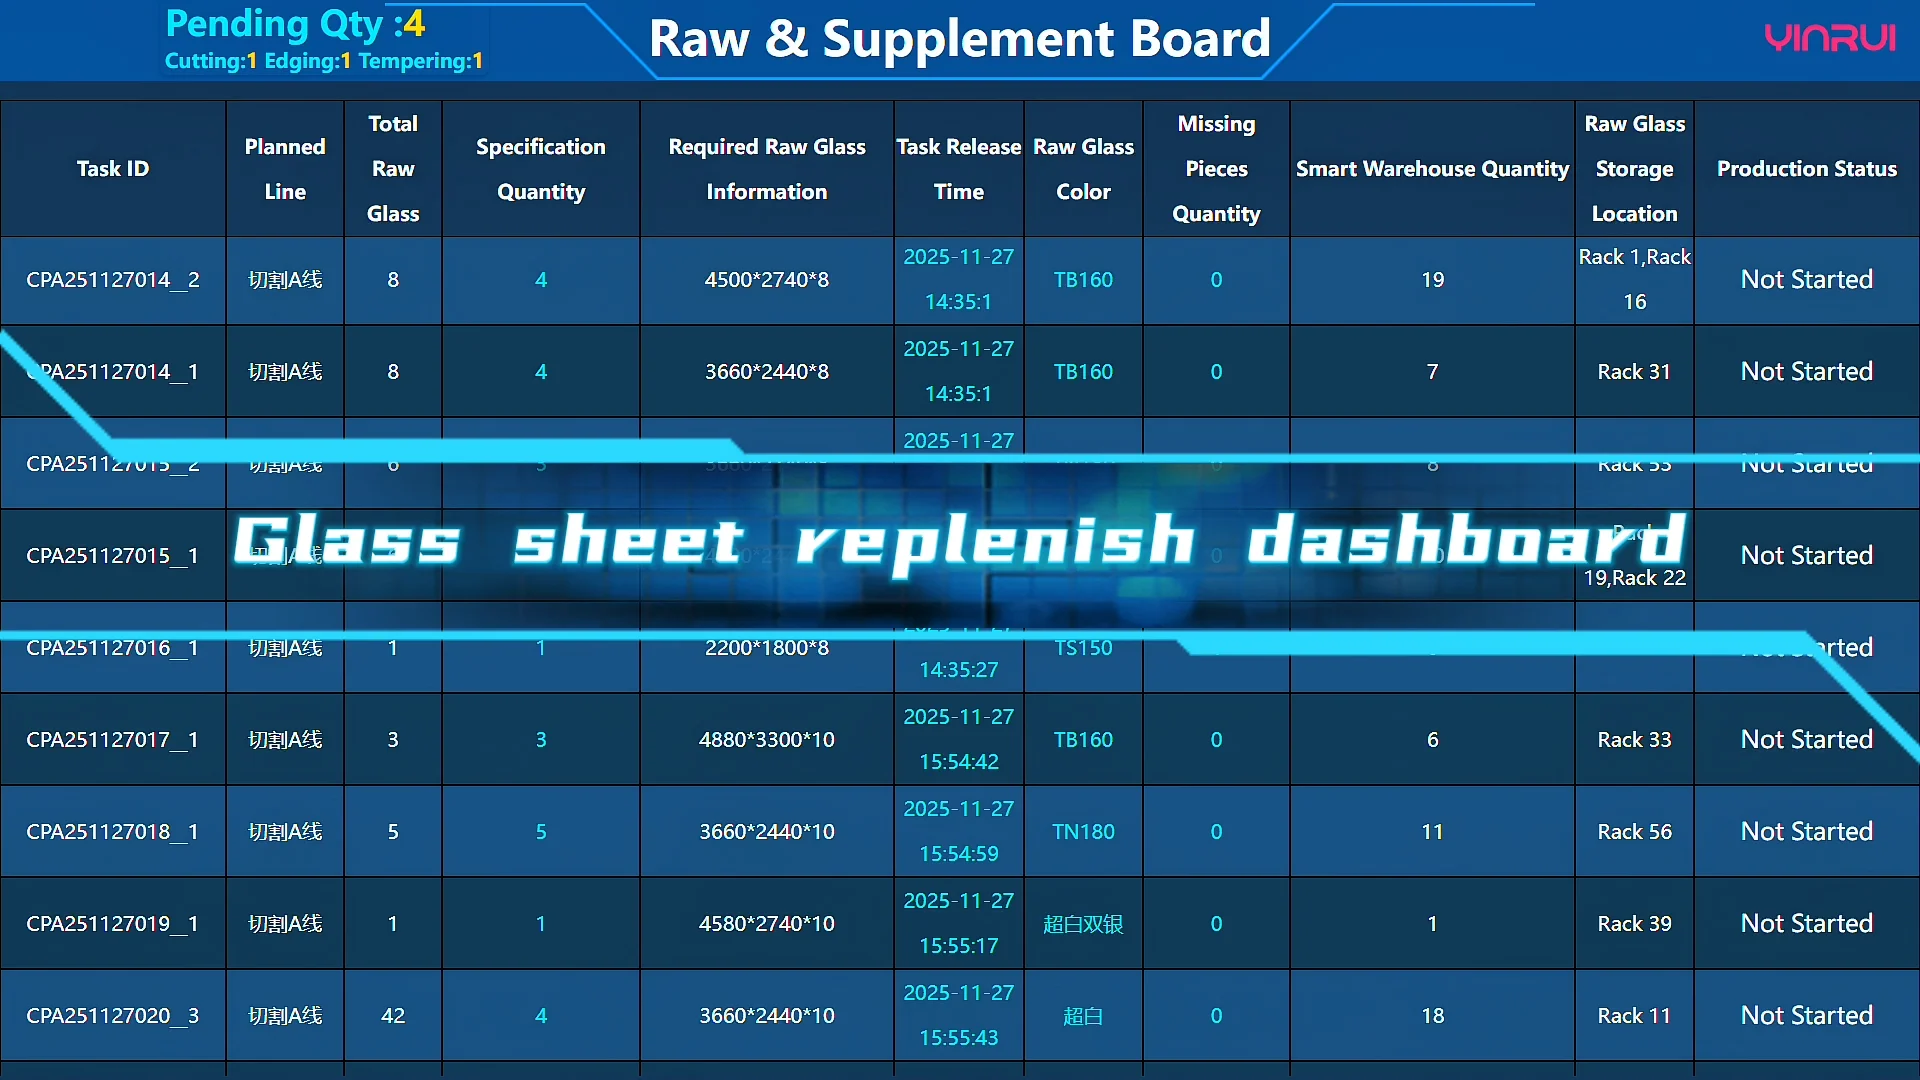
The workshop master dashboard serves as the central control hub for production supervisors. It provides real-time visibility into active production tasks, line-level material waiting status, tempering batch layouts, and equipment anomalies including idling, alarms, and broken glass detection.
Key benefit: Managers gain full oversight of production status without physical presence on the shop floor, enabling faster response to disruptions.
- Production Data Overview Dashboard
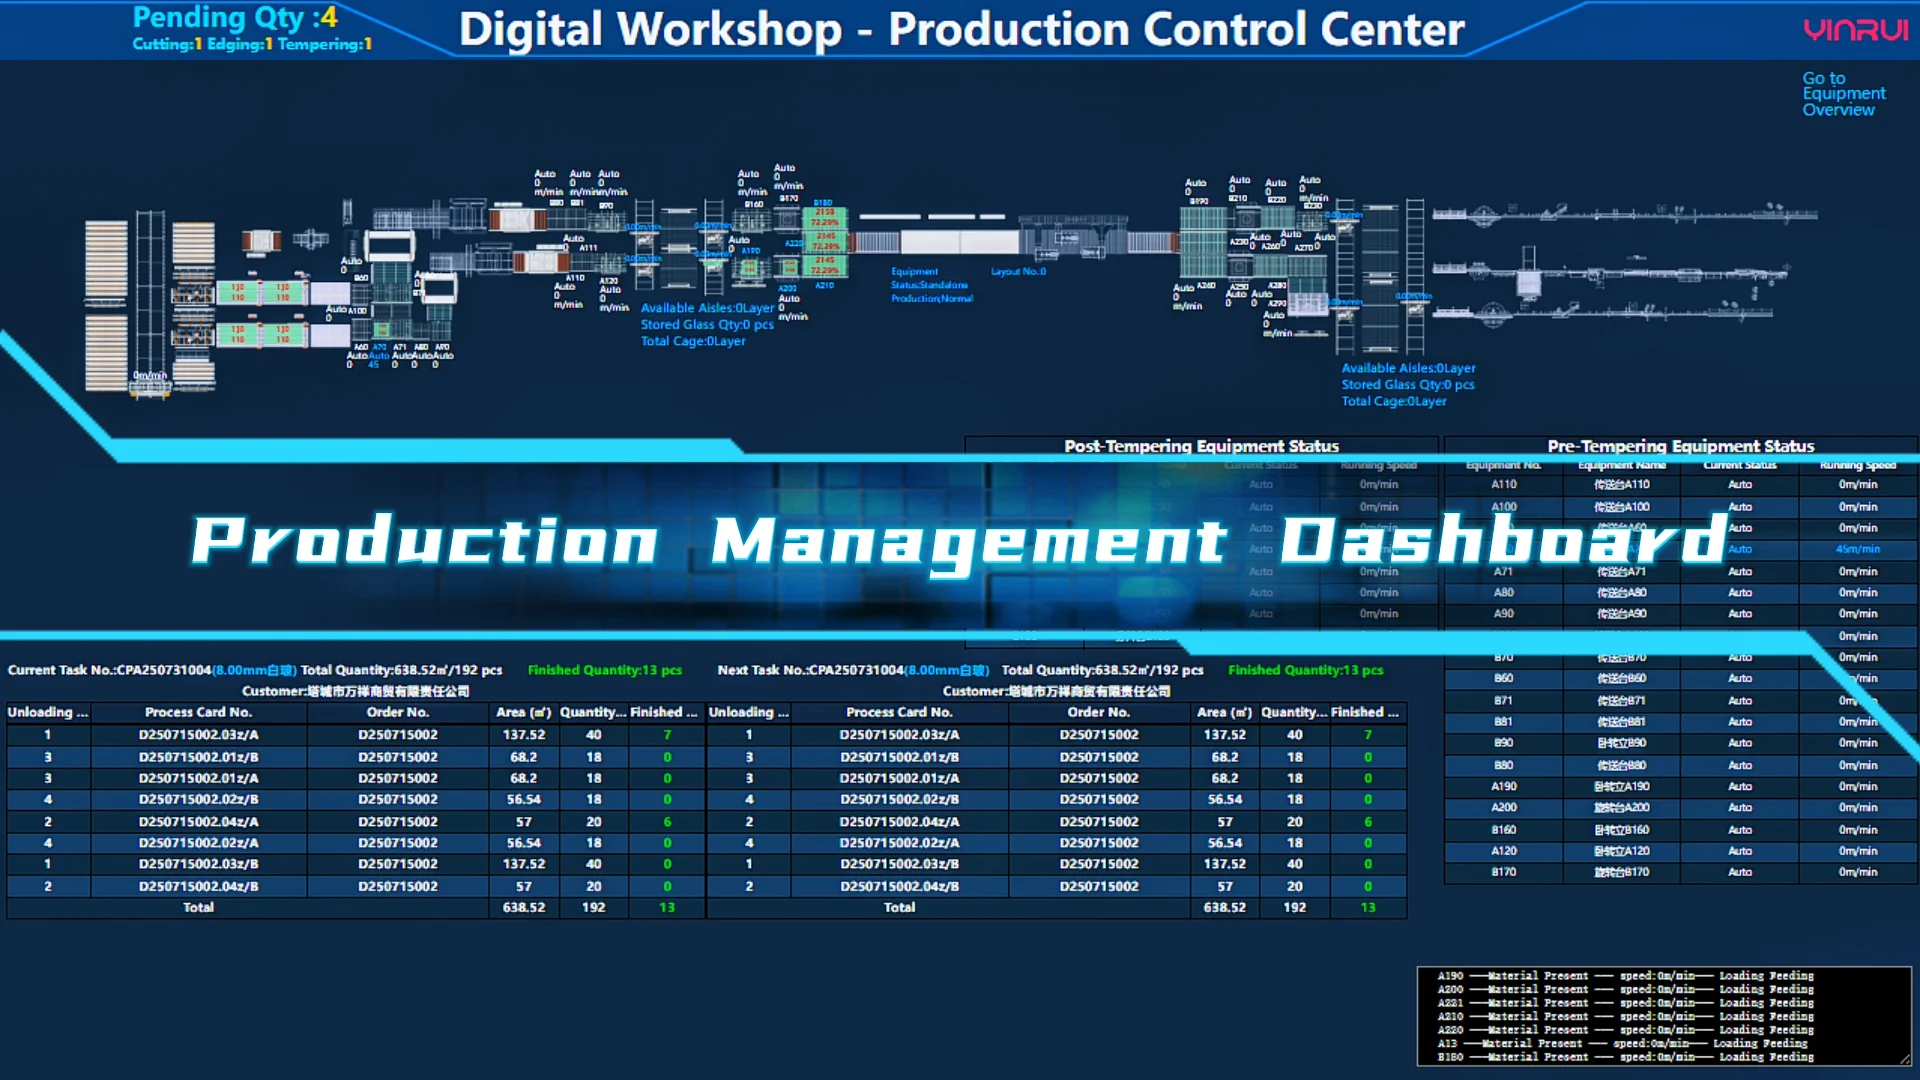
This production KPI dashboard aggregates plant-wide real-time metrics into a unified view, including original glass requisition and finished product warehousing volumes, cutting yield rate, tempering furnace loading rate, quality indicators, and energy consumption. It also supports comparative production trend analysis, planned vs. actual output tracking per process, and production task early warning alerts.
Key benefit: Enables data-driven identification of production bottlenecks and targeted process optimization.
- Glass Sheet Replenishment Dashboard
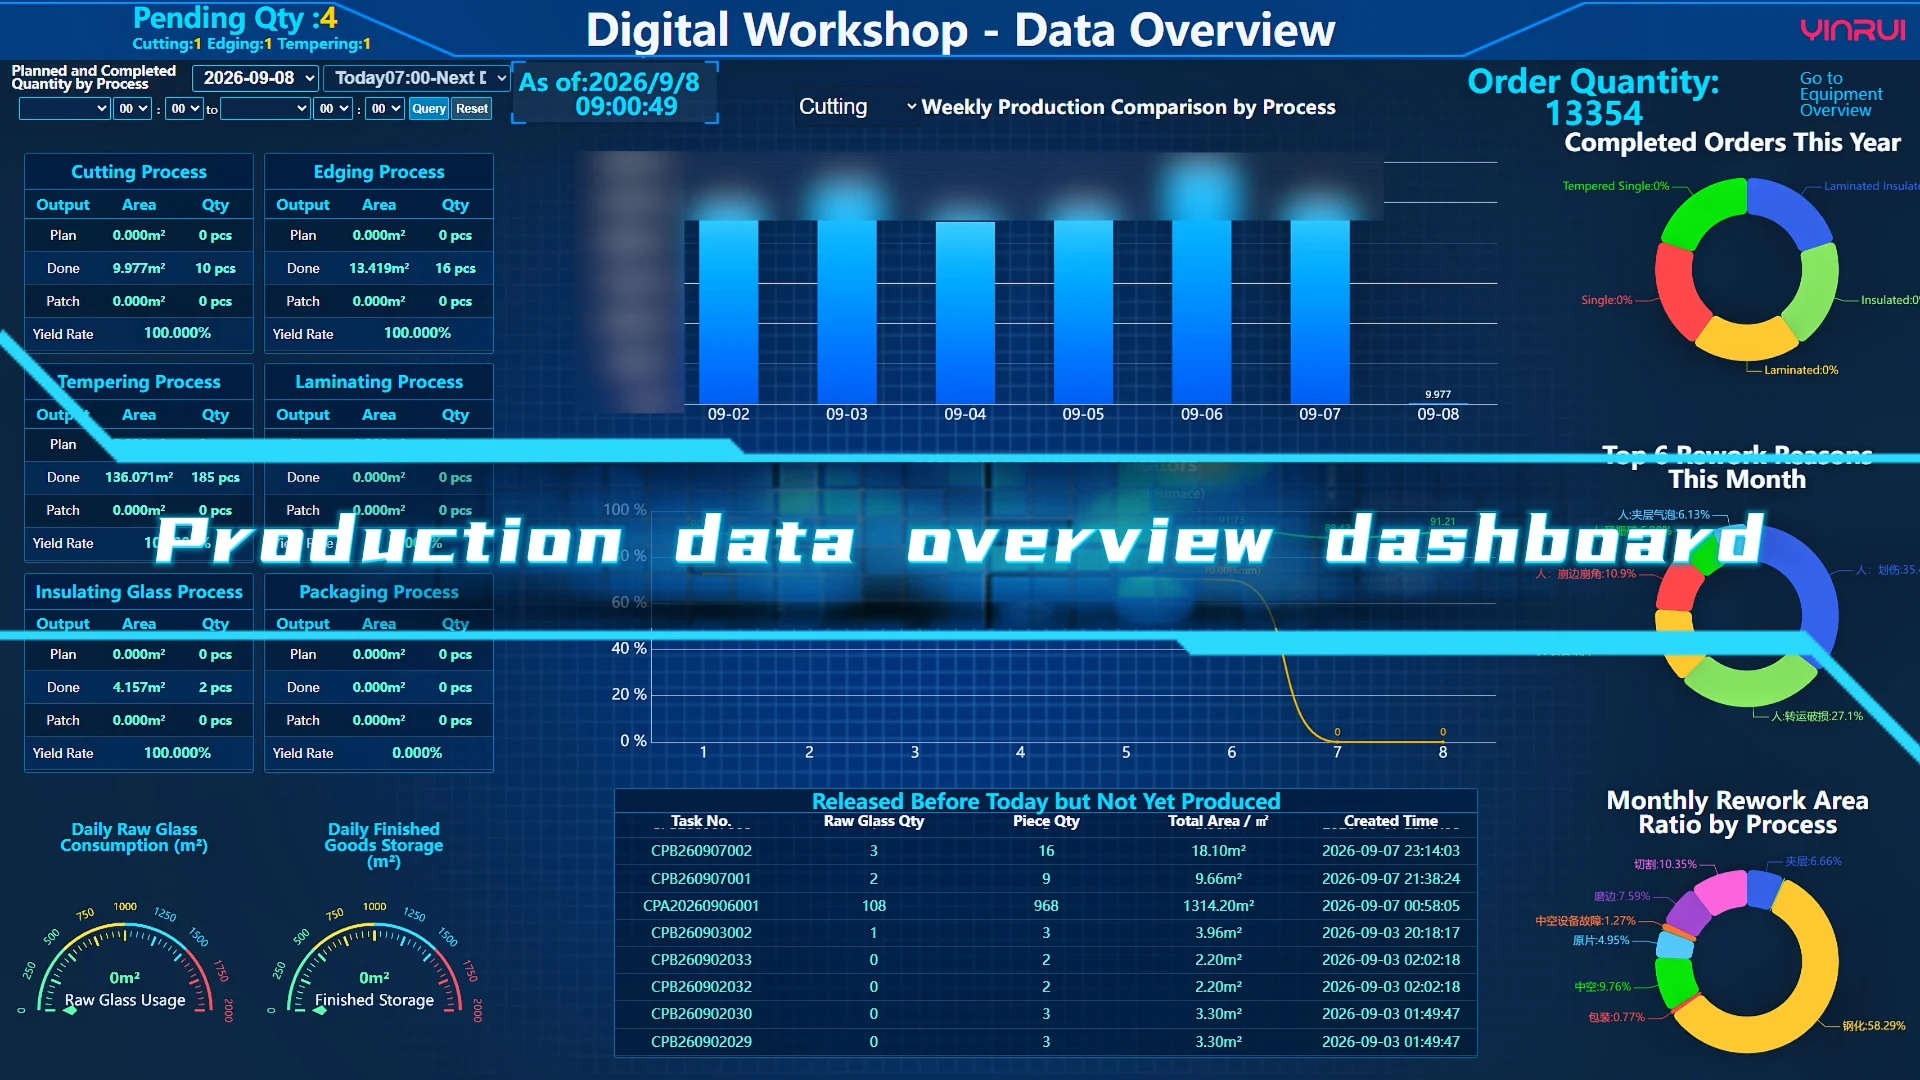
Designed for glass hoisting teams, the glass sheet replenishment dashboard delivers clear task assignments with exact storage locations, glass specifications, required quantities, and designated production line destinations within the intelligent warehouse system.
The system dynamically calculates glass demand based on production plans, following FIFO (First-In, First-Out) and loose-sheet-first scheduling principles to balance glass quality and warehouse turnover efficiency.
- Automation Line Task Dashboard
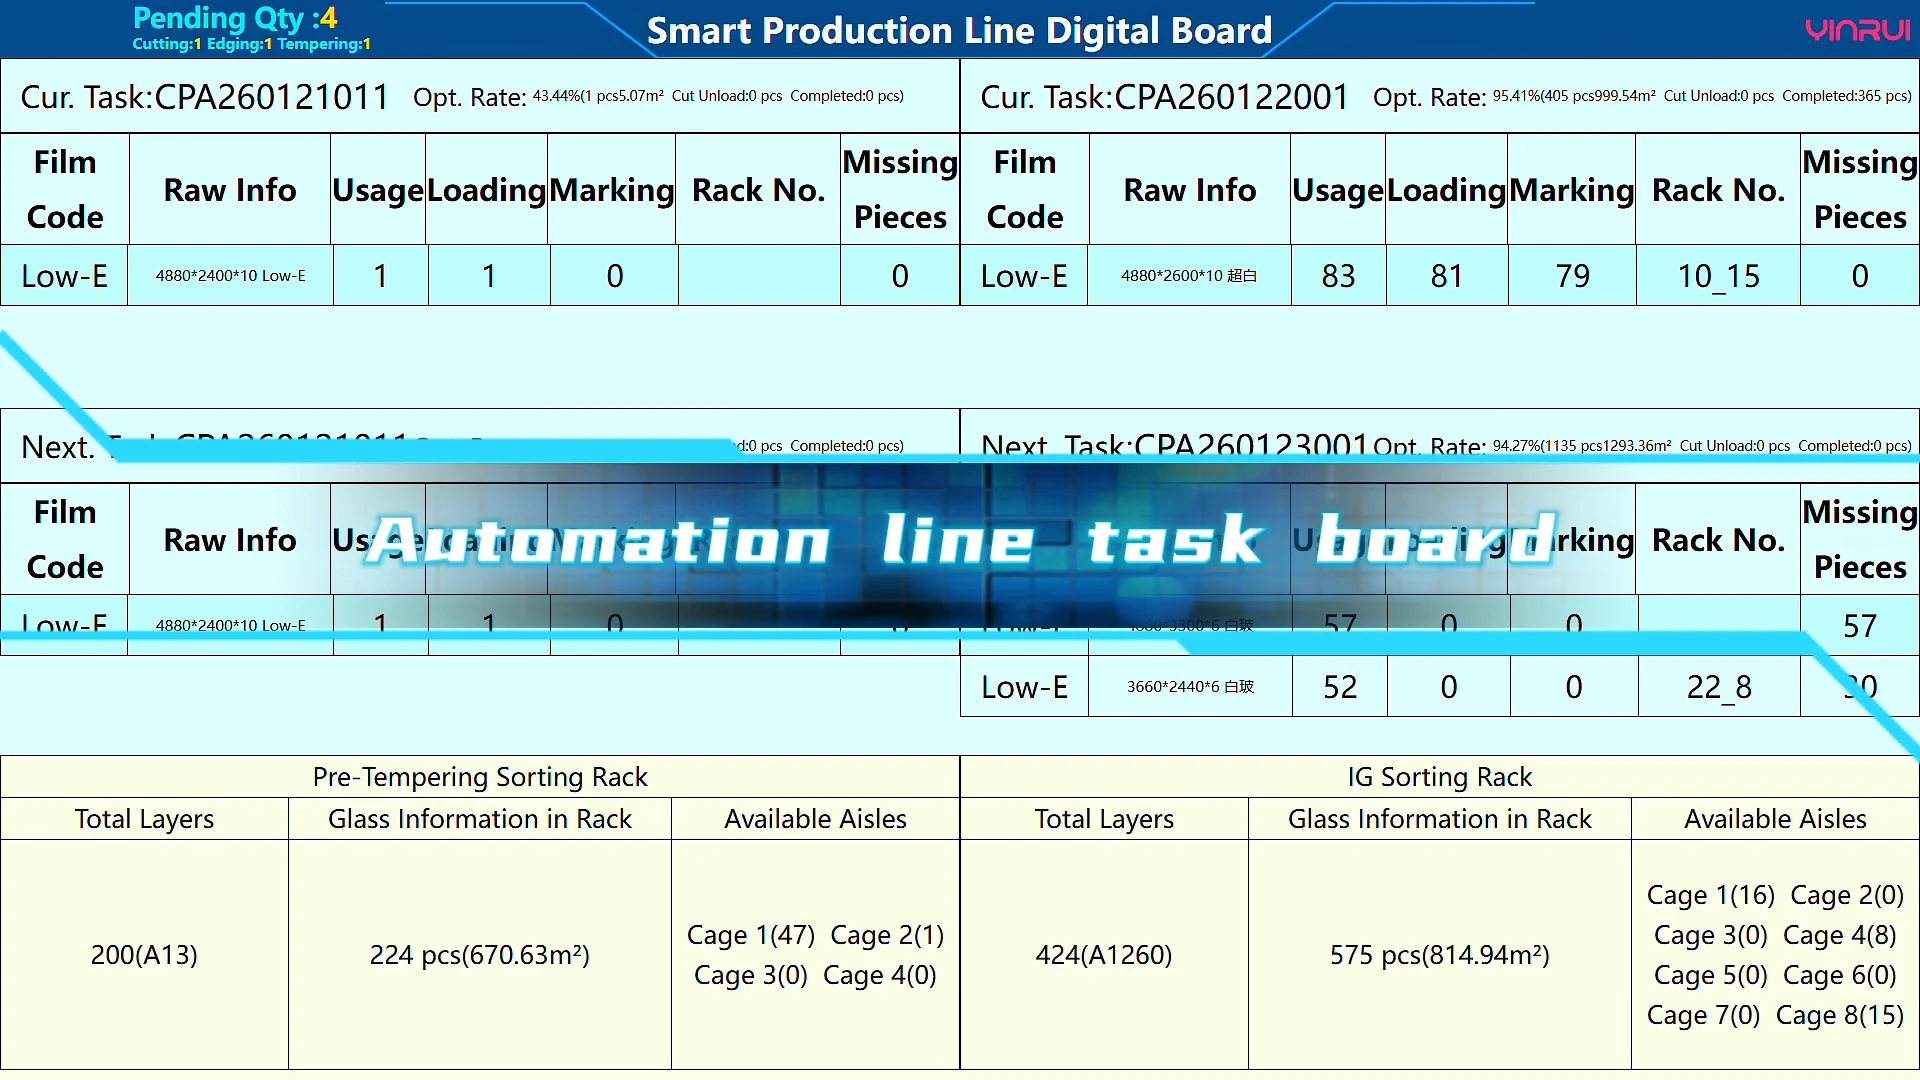
Cutting operators use the automation line task board to prioritize work orders, view current and upcoming cutting tasks, and verify raw material availability. By integrating glass sorting machine status data, the dashboard also predicts cutting-to-edging cycle times to ensure seamless production continuity.
- Cutting & Breaking Dashboard
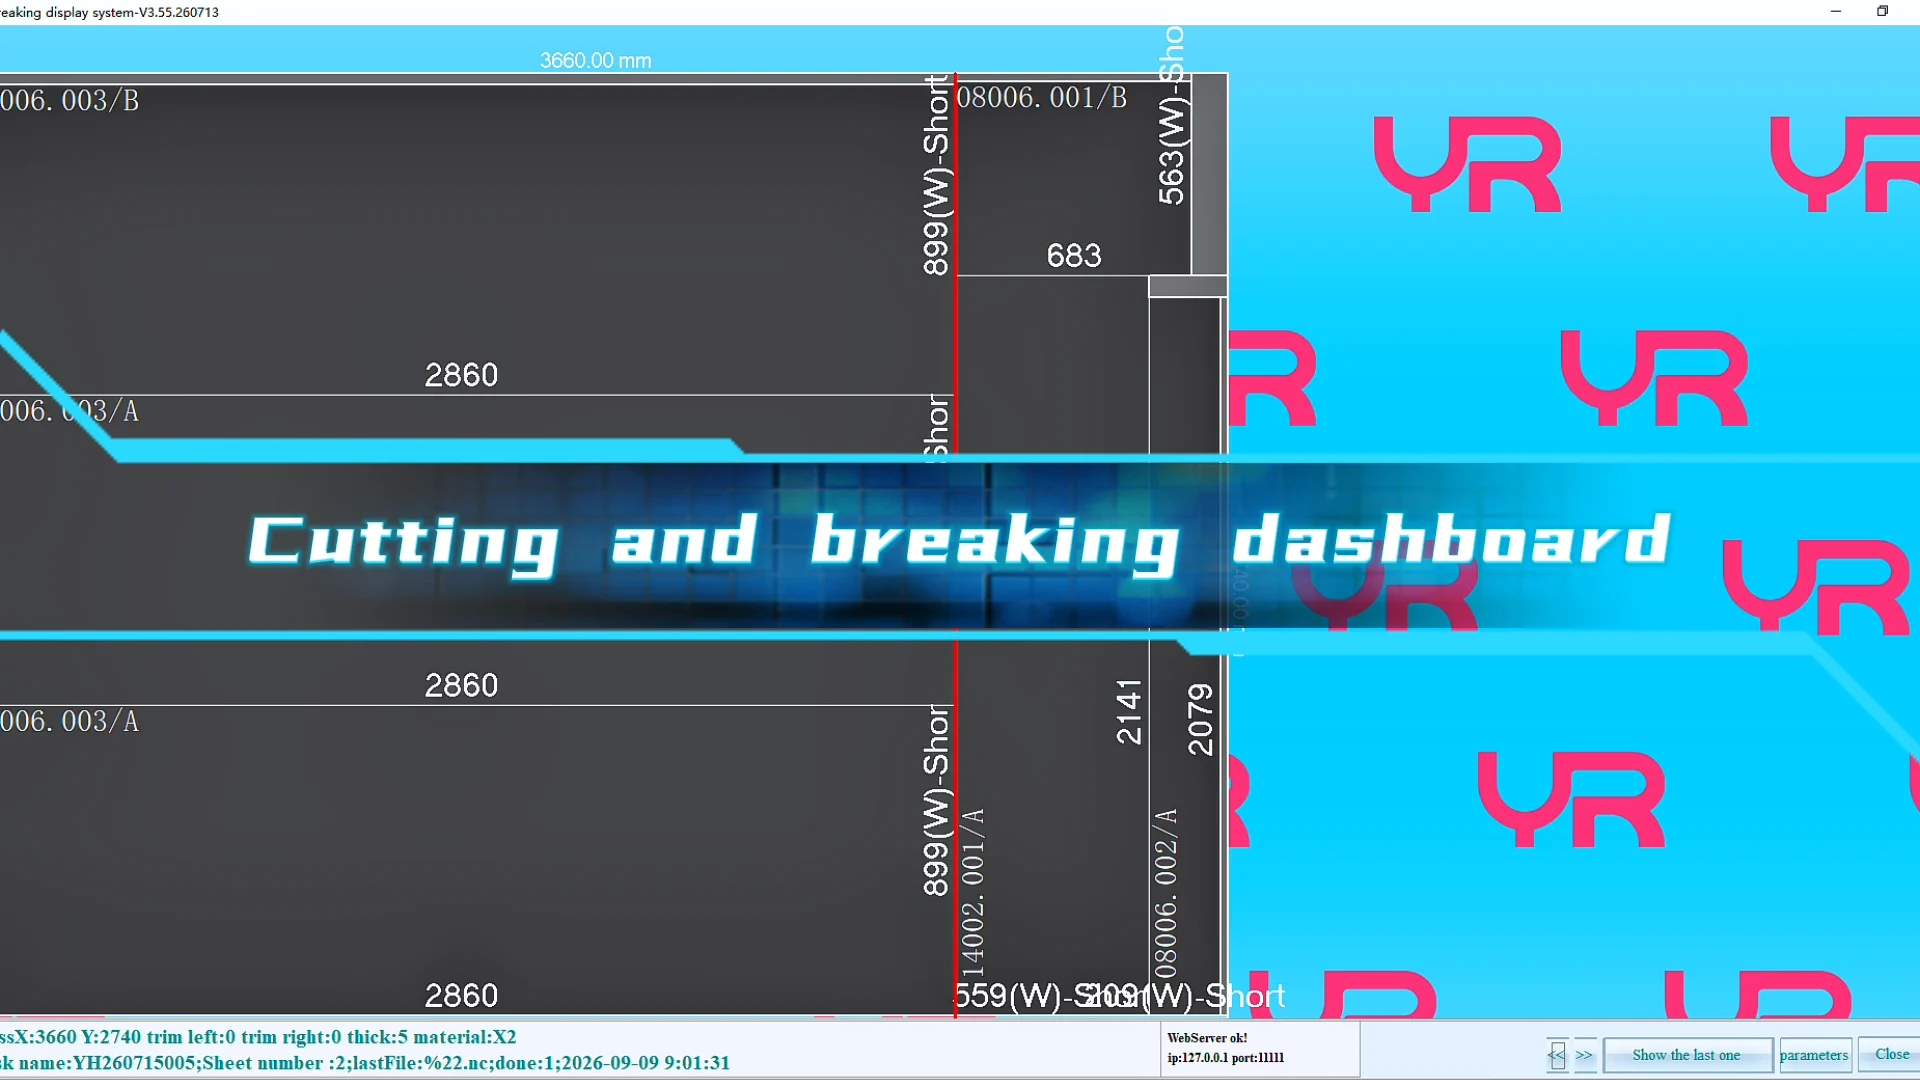
This glass processing dashboard displays precise layout details for breaking tasks, including original sheet dimensions, material type, thickness, and edge lengths. Operators follow on-screen guidance to complete breaking, transfer glass to scanning stations, and unload sheets to racks. The system also shows offcut information and supports automatic label printing for remnant glass.
- Single Piece Defect Detection Dashboard
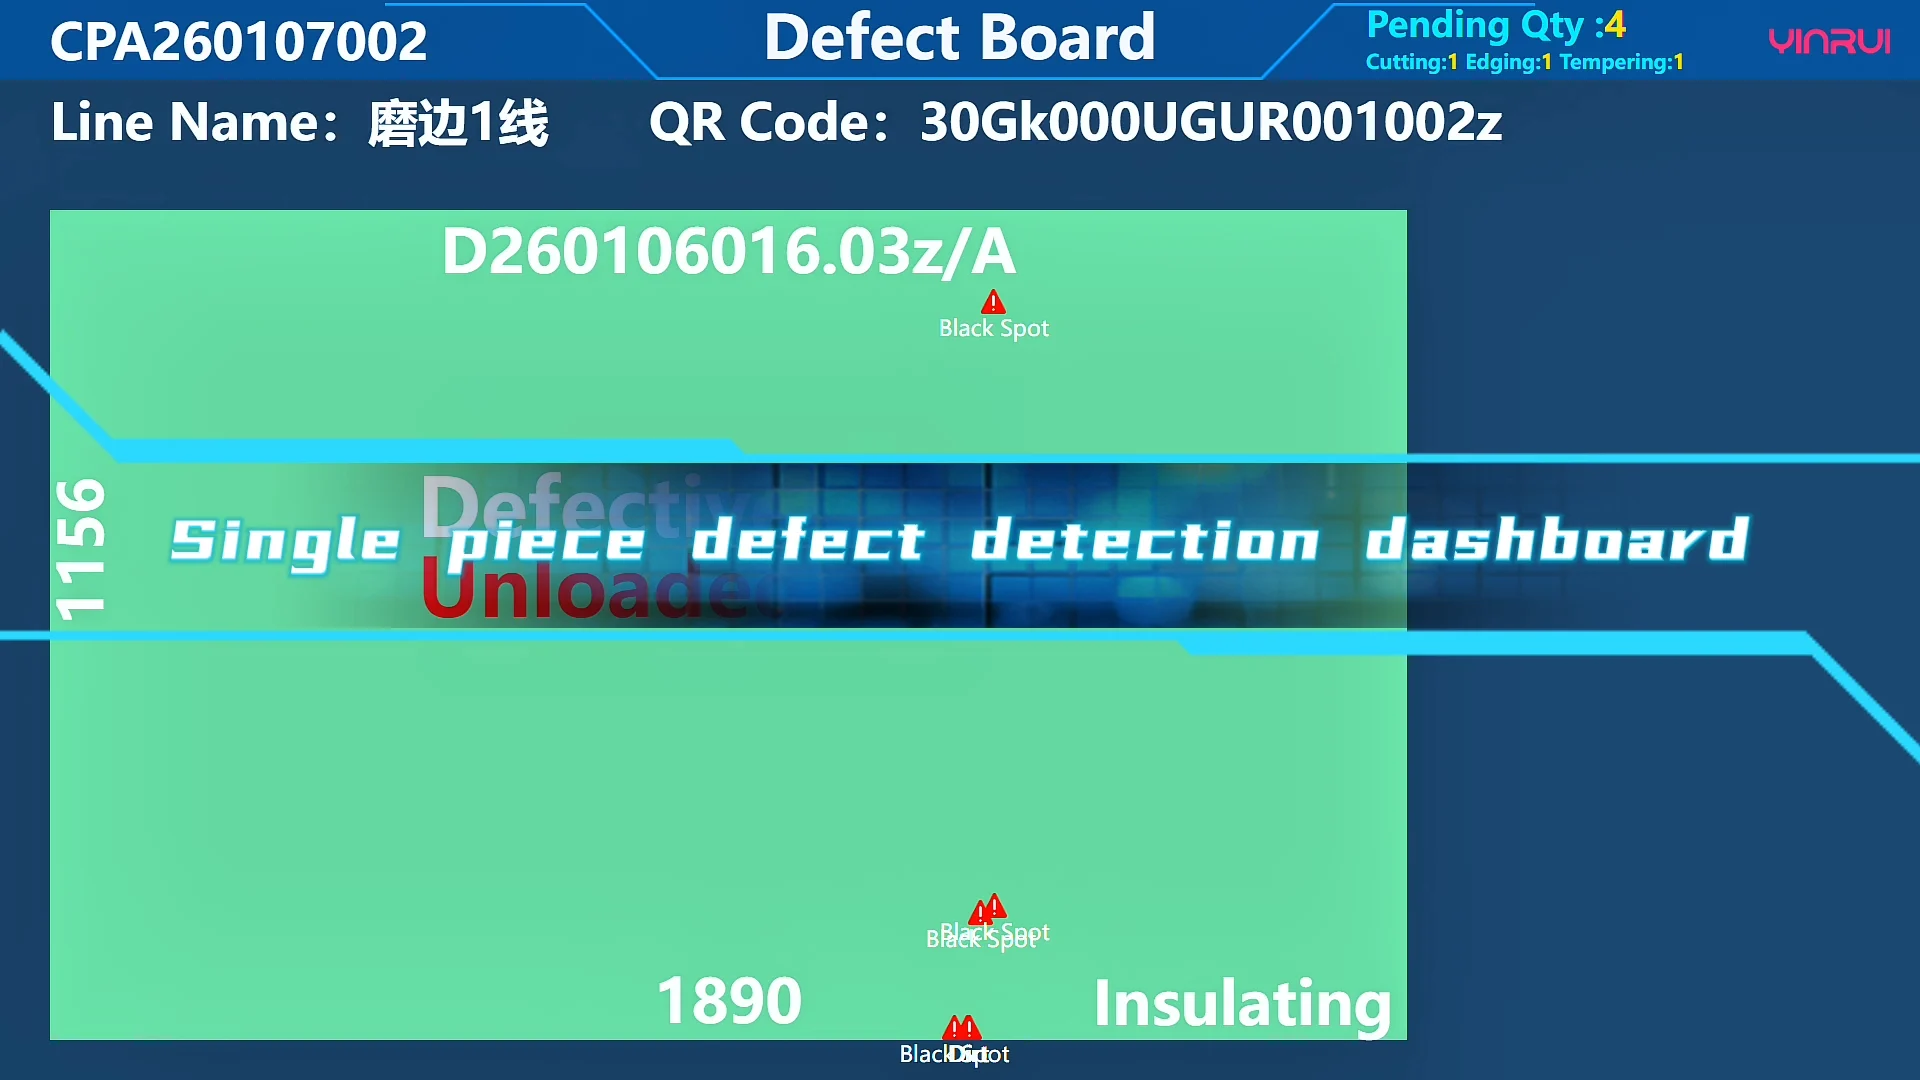
To prevent production line bottlenecks, defective glass after edging first enters buffer cages. When the sorting AGV is free or operators manually flag defective sheets, the system routes them to inspection stations. The single piece defect detection dashboard displays defect details for manual verification; approved sheets return to the buffer, while rejected units are scanned and logged as scrap.
- Vertical Sorting Dashboard Before Tempering
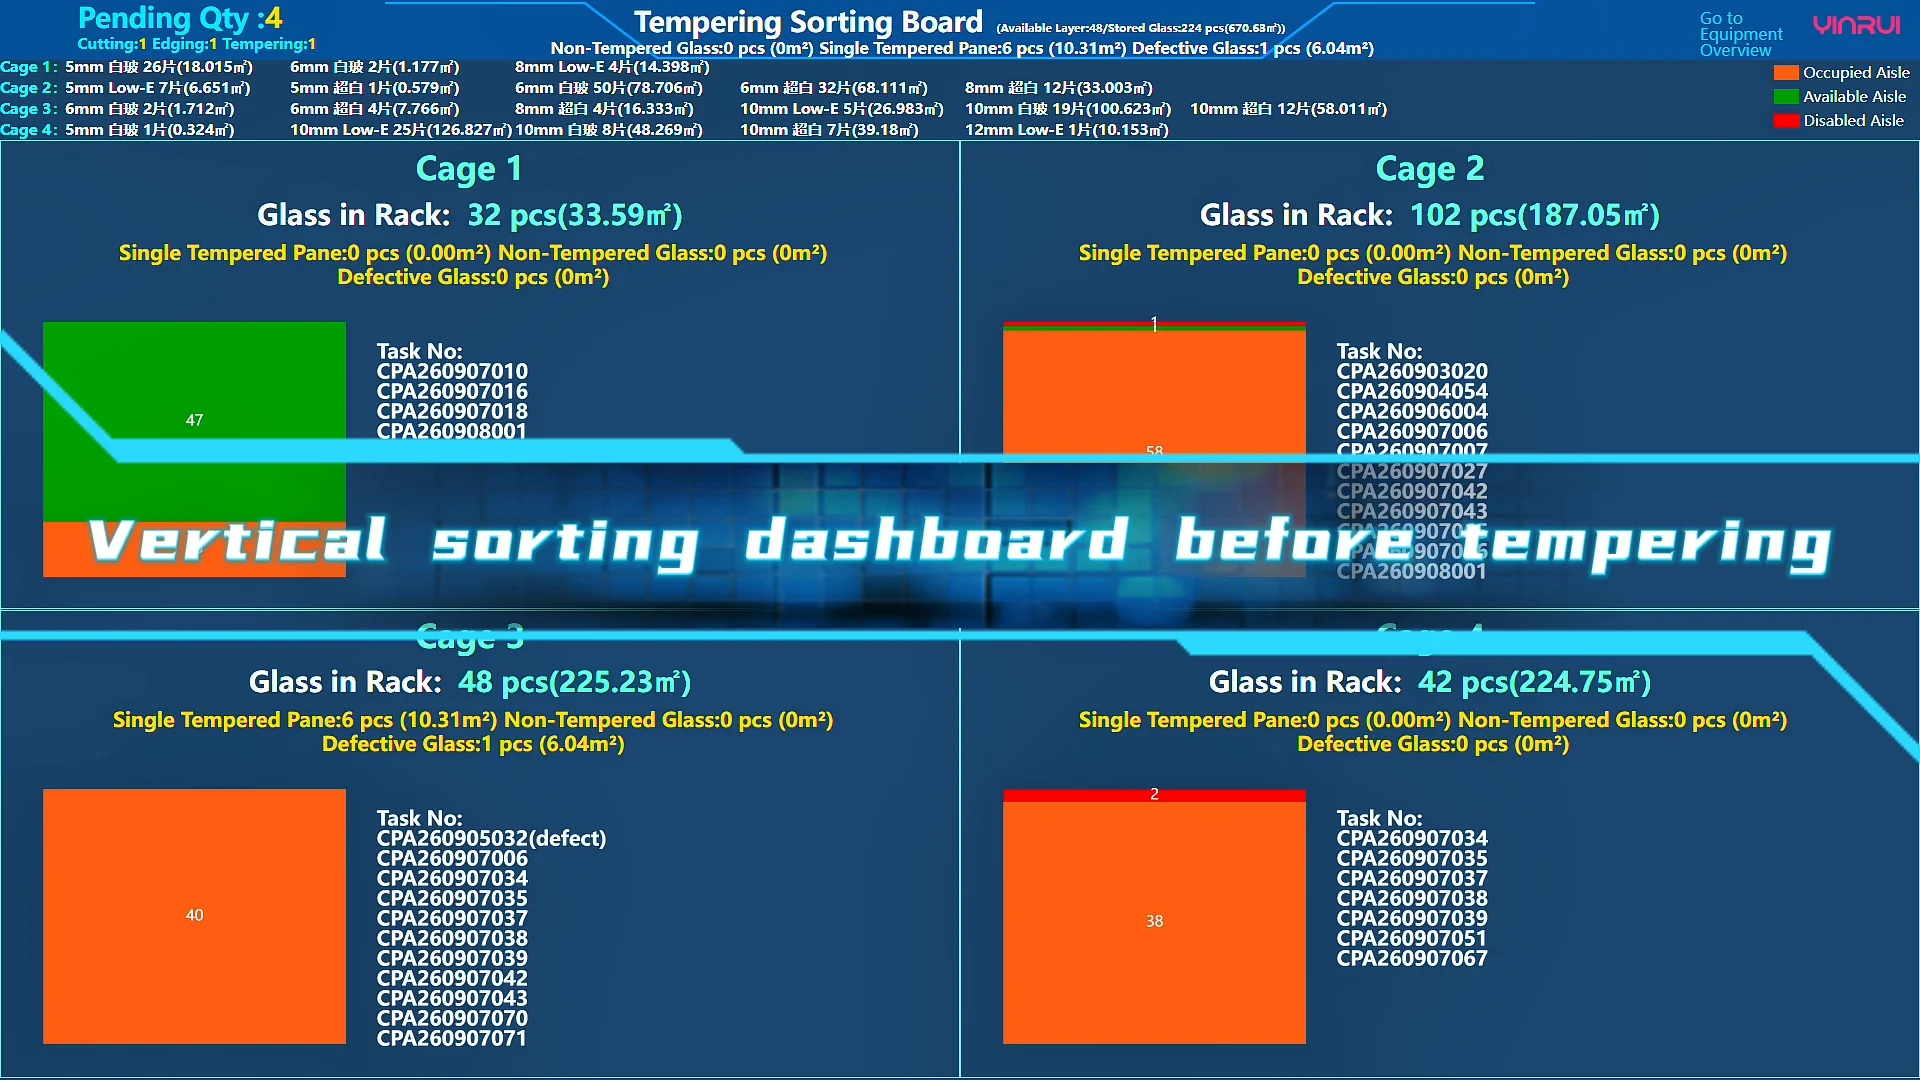
The tempering preparation dashboard provides real-time visibility into sorting buffer slot occupancy, assigned tasks, and processing specifications. By combining data on glass thickness and color distribution, it enables more scientific and efficient production scheduling for the tempering furnace.
- Tempering Process Support Dashboards
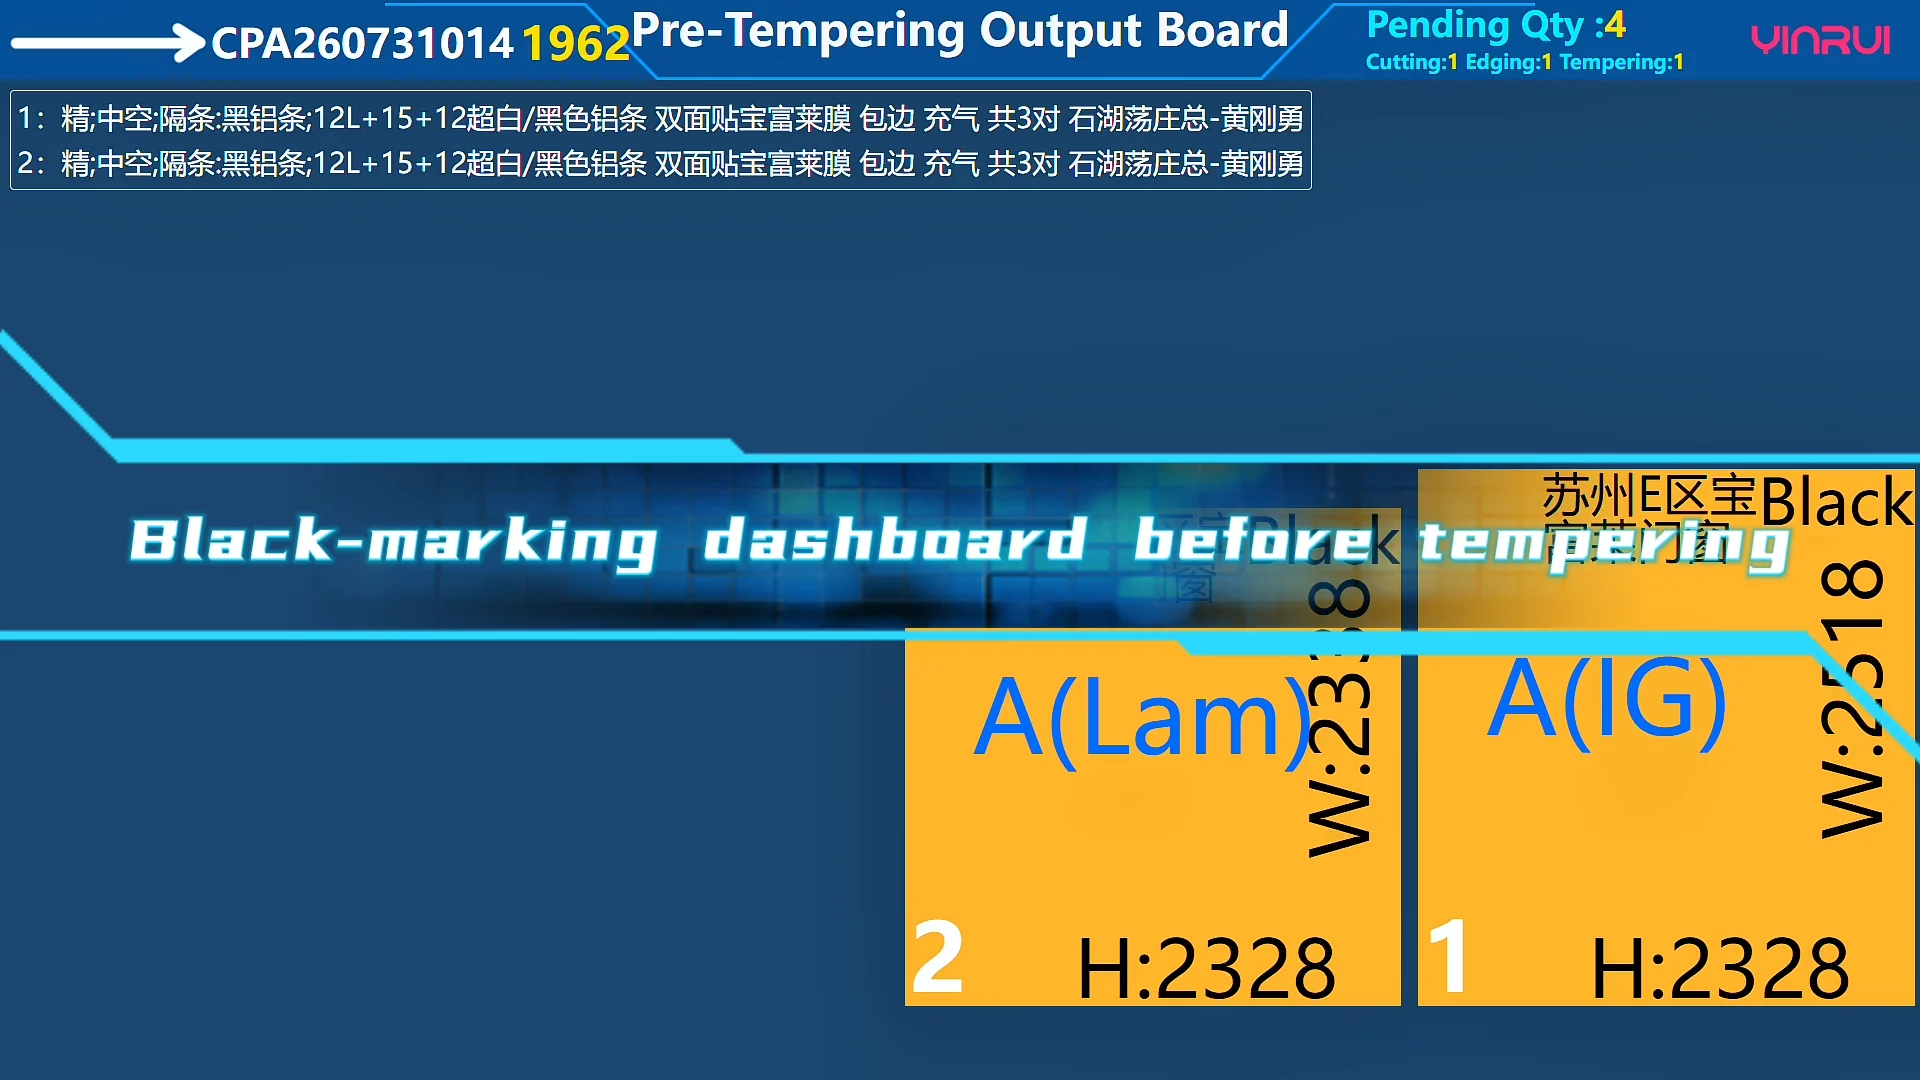
Black-Marking Dashboard Before Tempering: For orders requiring black mark printing, this tool helps tempering operators quickly locate designated glass and identify exact printing positions, improving accuracy and reducing setup time.
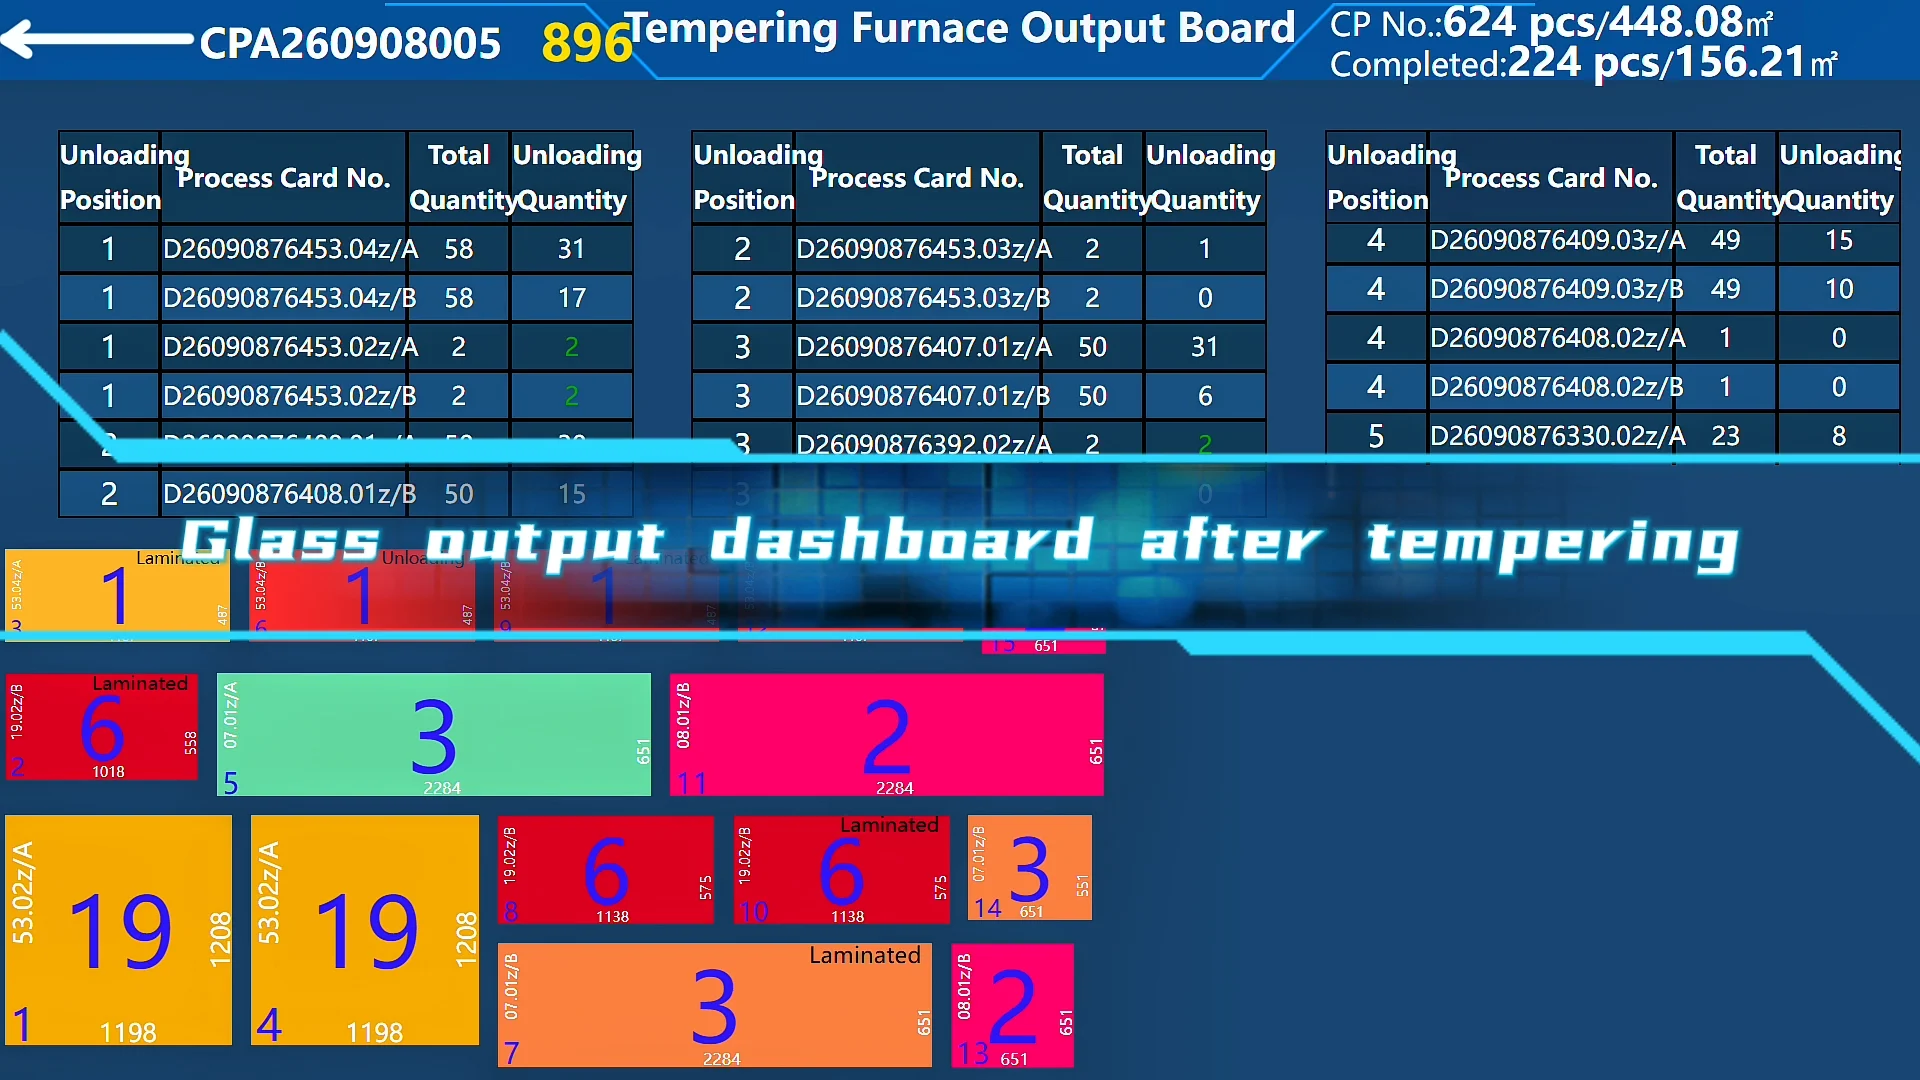
Glass Output Dashboard After Tempering: Guides operators in sorting furnace output—distinguishing between manually unloaded sheets and those fed into automation lines—with color-coded rack management for intuitive visual control. Entries turn green once unloading is confirmed.
- Insulating Glass (IG) Production Dashboards
Our insulating glass production dashboard suite optimizes every step of IG fabrication:
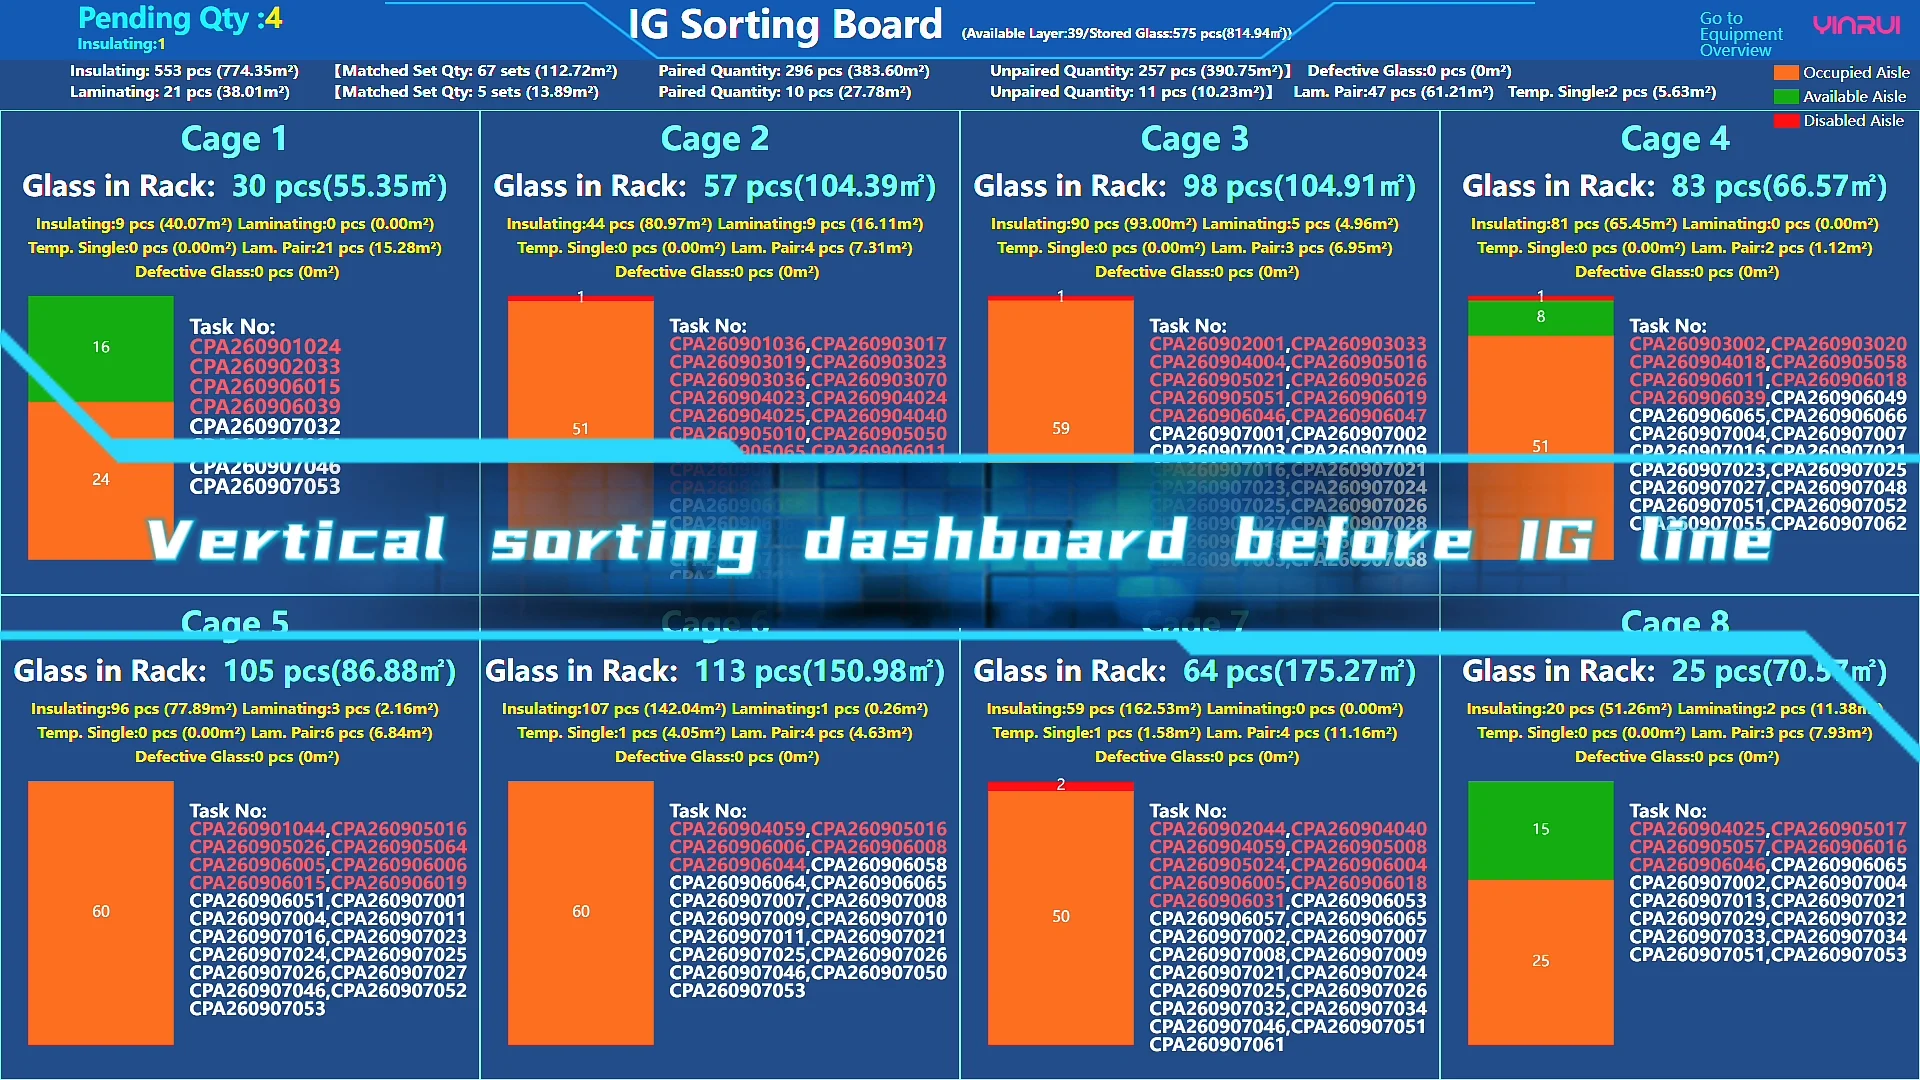
Vertical Sorting Dashboard Before IG Line: Summarizes buffer orders by type and matching status, with per-slot glass visibility and visual overdue task alerts.
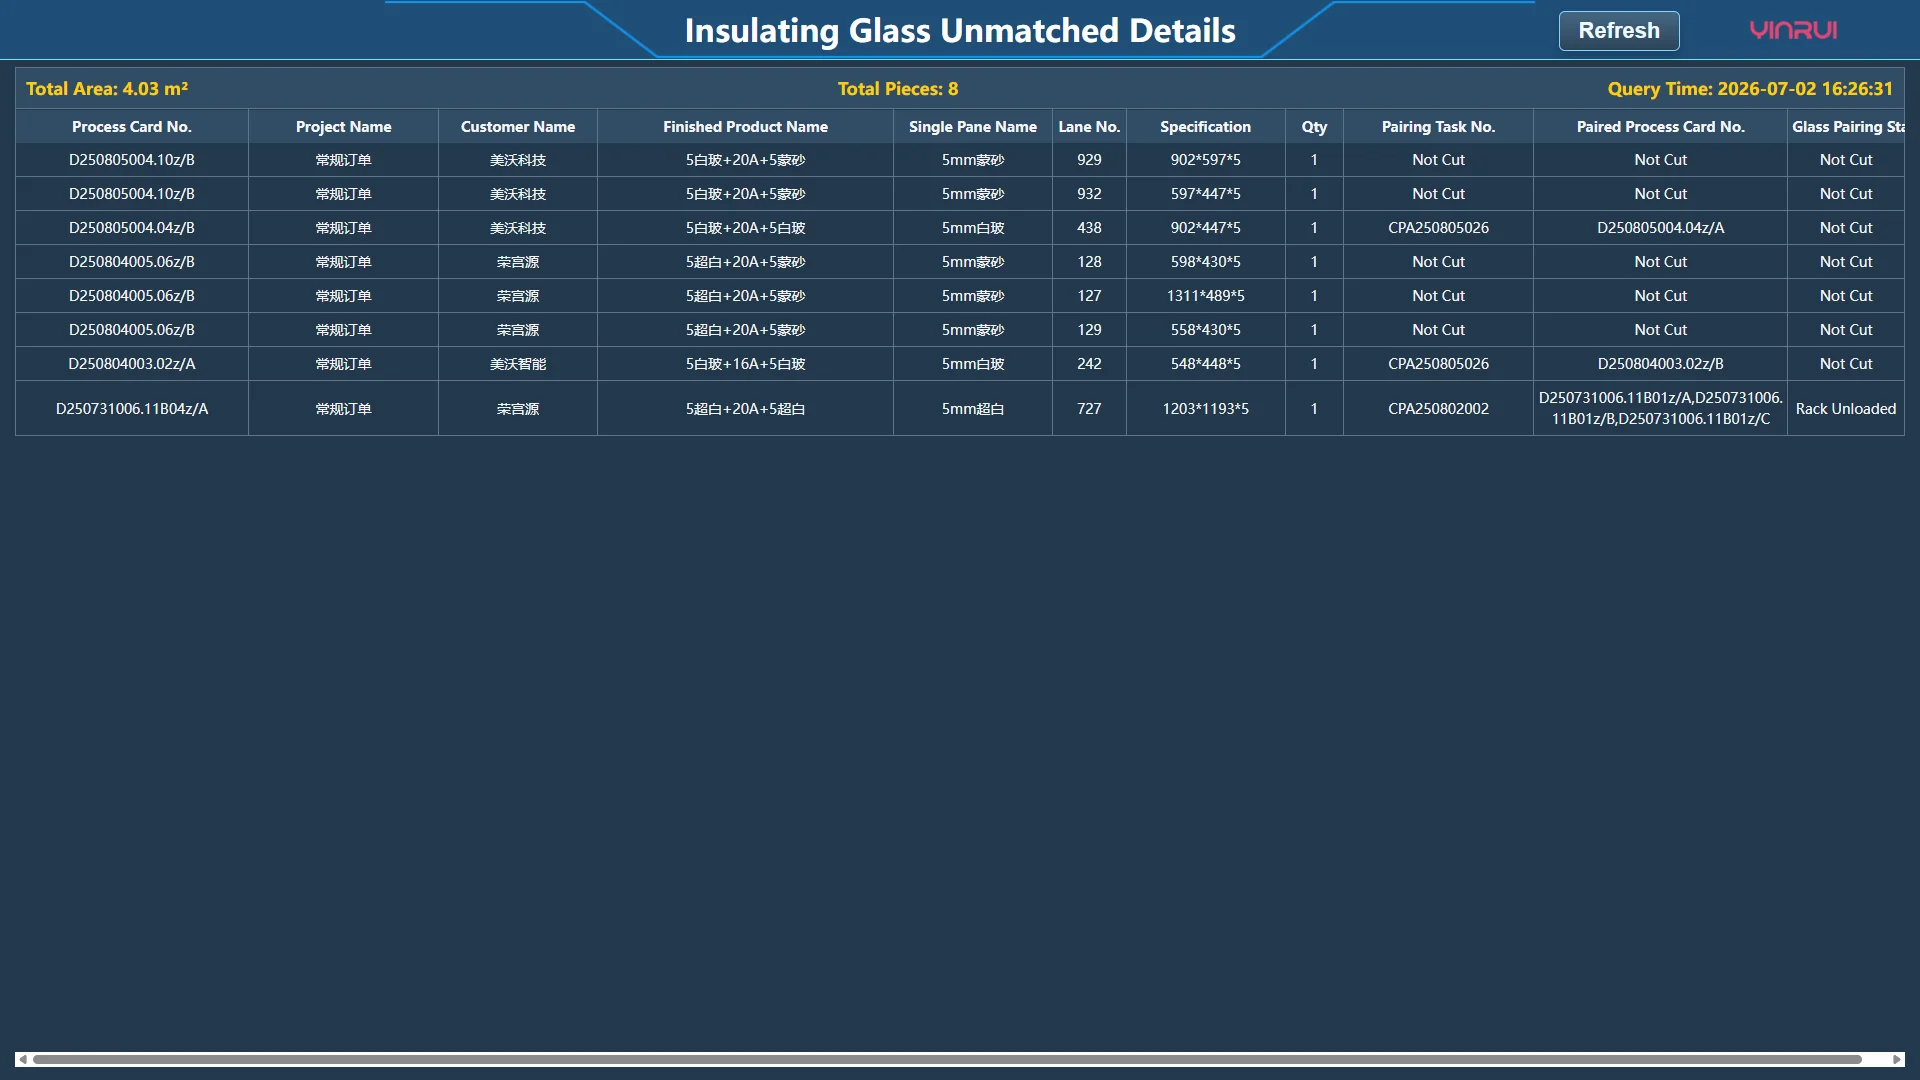
Unmatched Dashboard for IG & Laminating Line: Shows detailed unmatched glass data for IG and laminating buffers, enabling fast replenishment tracking and material location across production stages.
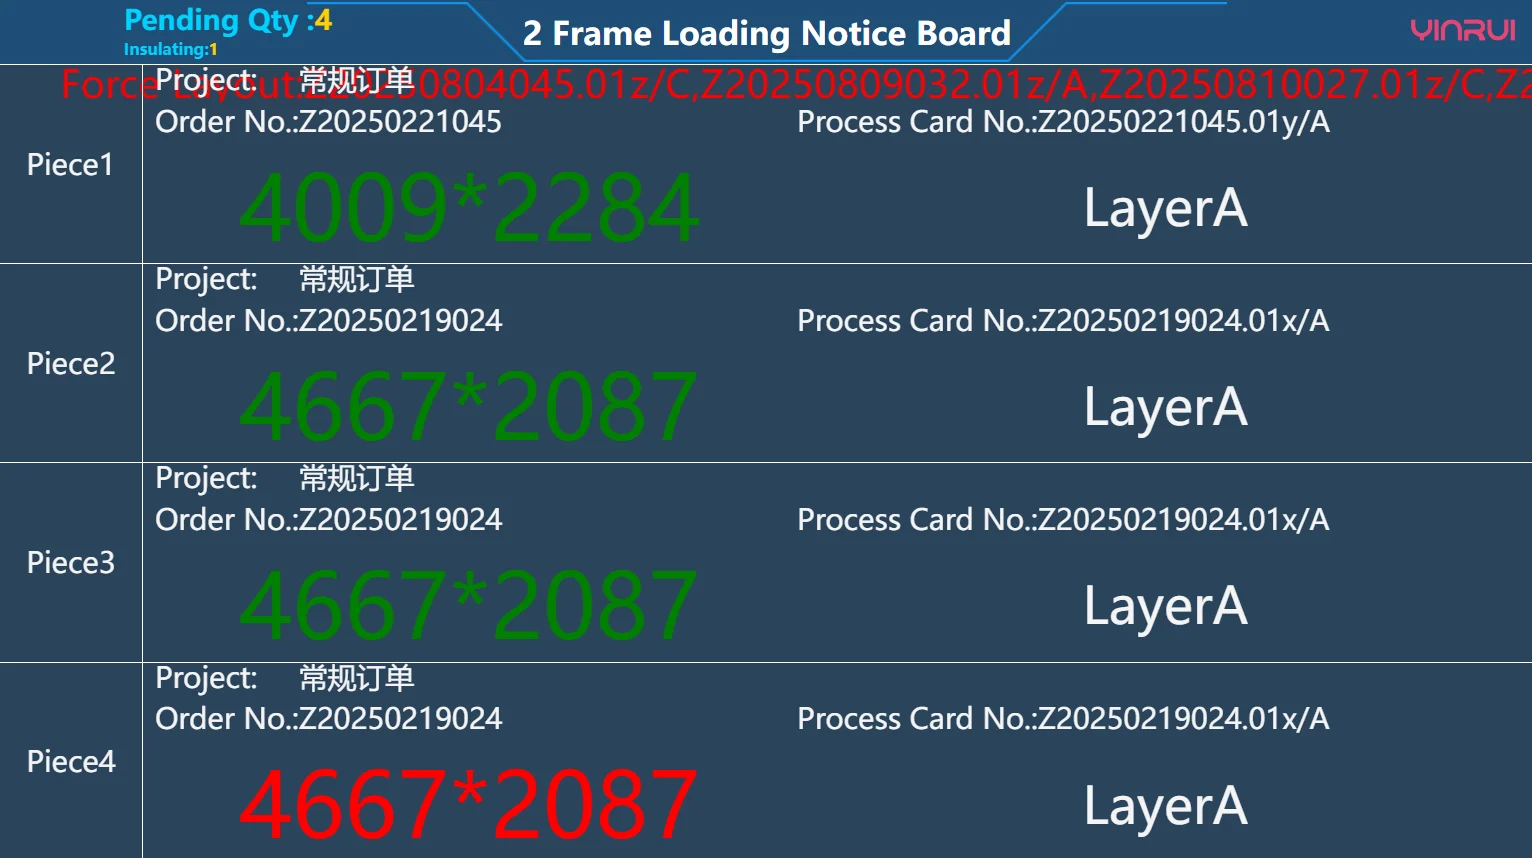
Frameloading Dashboard for IG Line: Displays current tasks and glass specifications to help operators precisely locate required aluminum frames and verify glass-label-spacer matching.
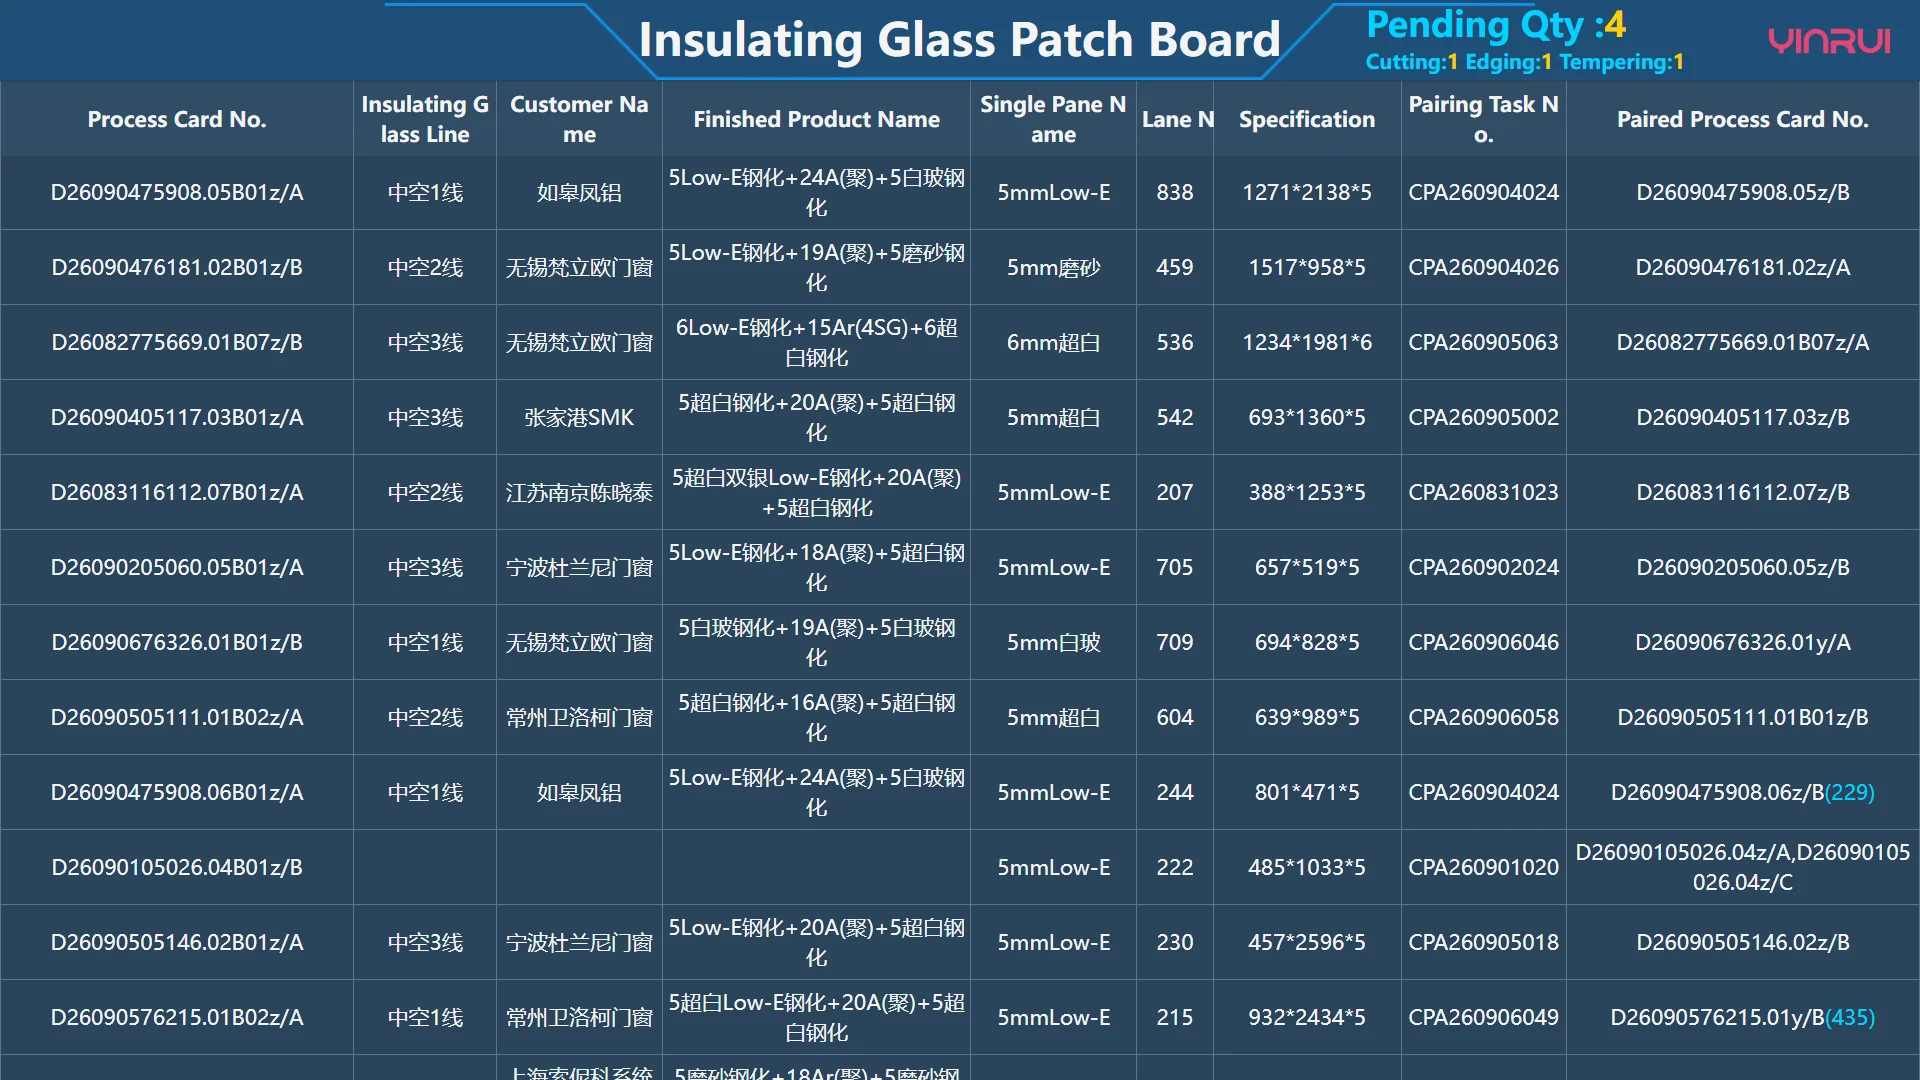
Replenish Dashboard for IG Line: Allows IG line operators to quickly confirm and track replenishment data for clearer task scheduling.
- Laminating Dashboard
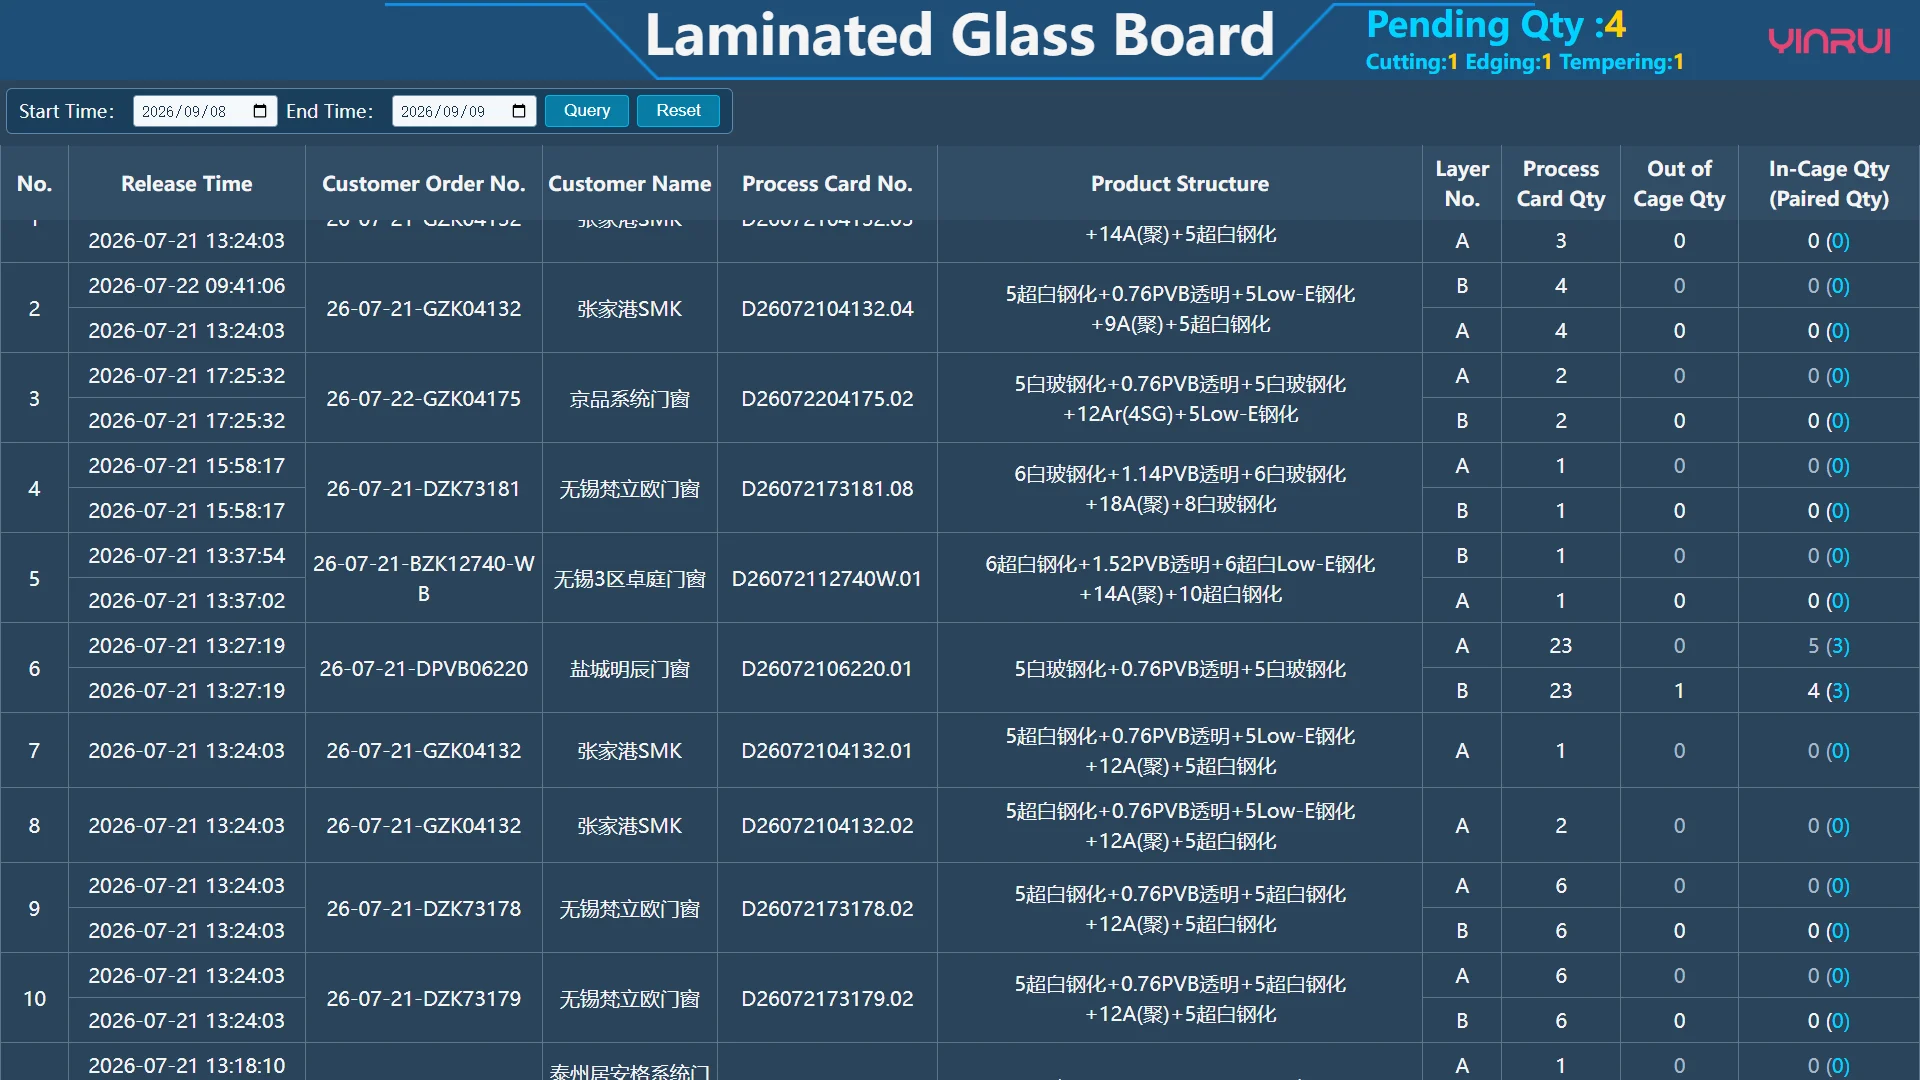
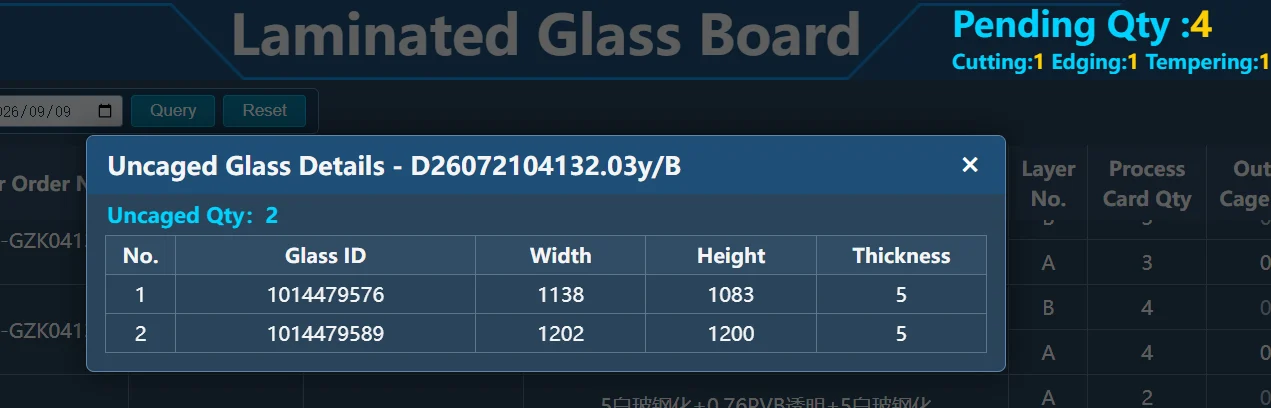
The laminated glass dashboard provides detailed visibility into task pairing status within laminating line buffers. Operators use this data to organize work efficiently, reducing manual inquiry time and production wait times. Clicking buffer quantities reveals detailed small-piece information for each process card.
Part 2: ERP Series Dashboards for Enterprise-Wide Business Visibility
As an enterprise management system, ERP houses the full end-to-end business chain, but extracting key insights quickly can be challenging. Yinrui’s ERP dashboard for glass manufacturing transforms raw business data into intuitive, actionable overviews:
- Replenishment Progress Tracking
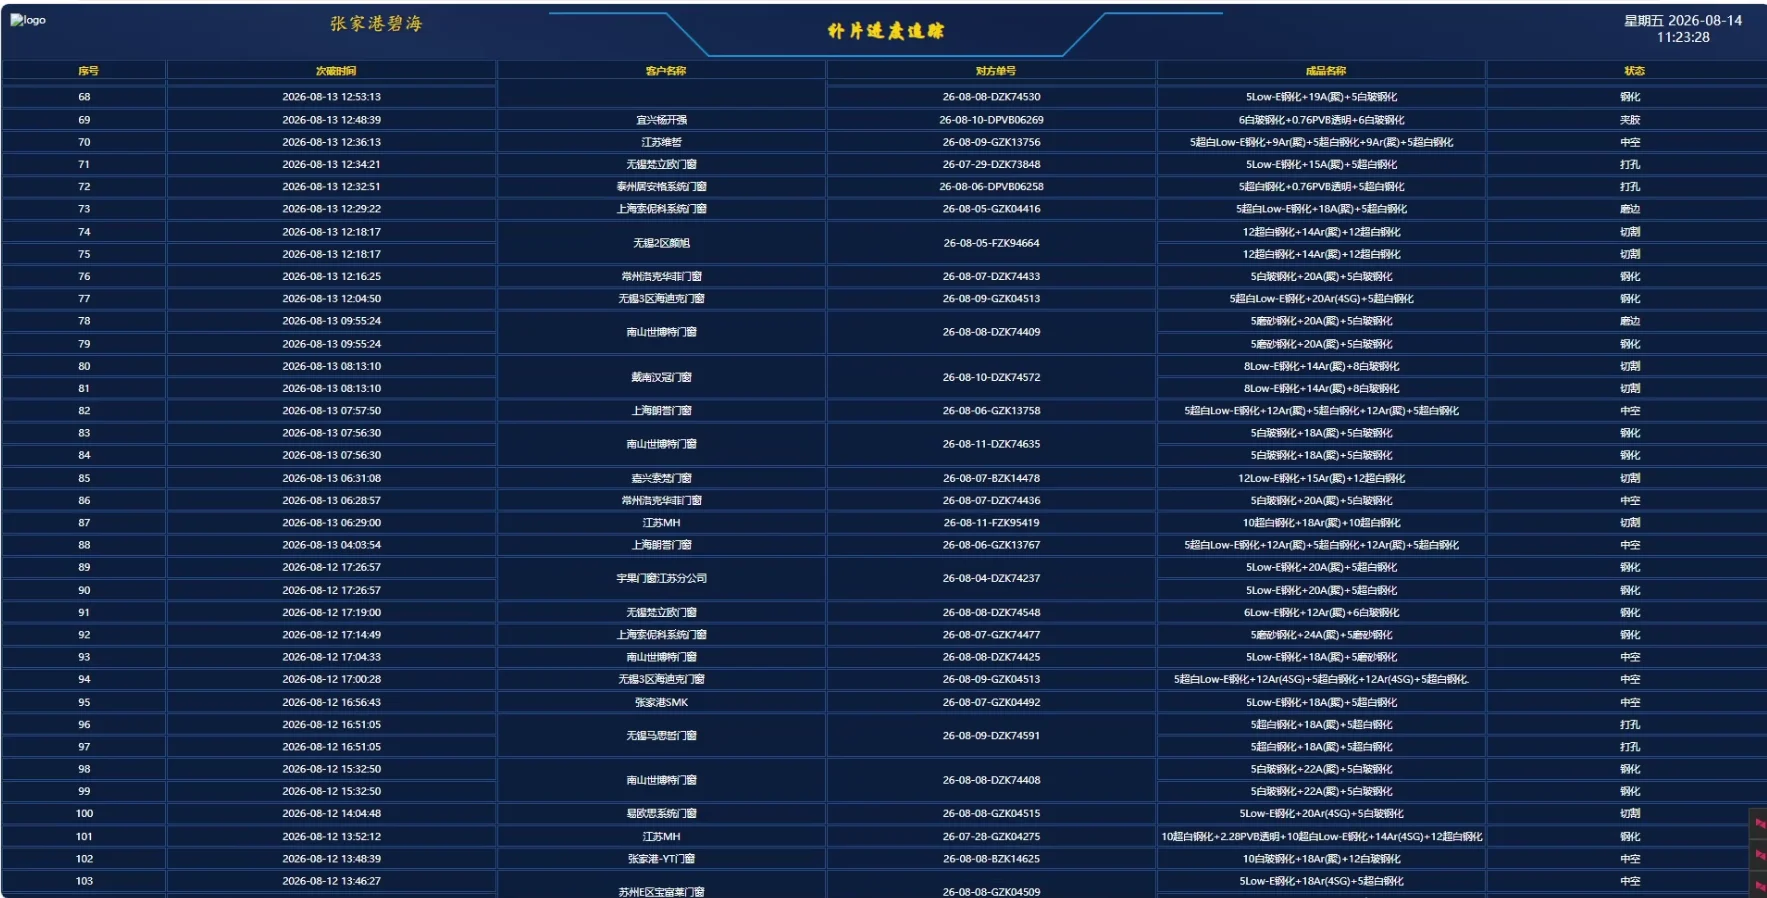
The plant-wide replenishment tracking dashboard lets production managers locate replenishment items instantly and view their current production stage. If a replenishment task remains unprocessed beyond a set timeframe, the system triggers a pre-overdue alert to boost efficiency and shorten production cycles.
- Cutting & Replenishing Glass Tracking
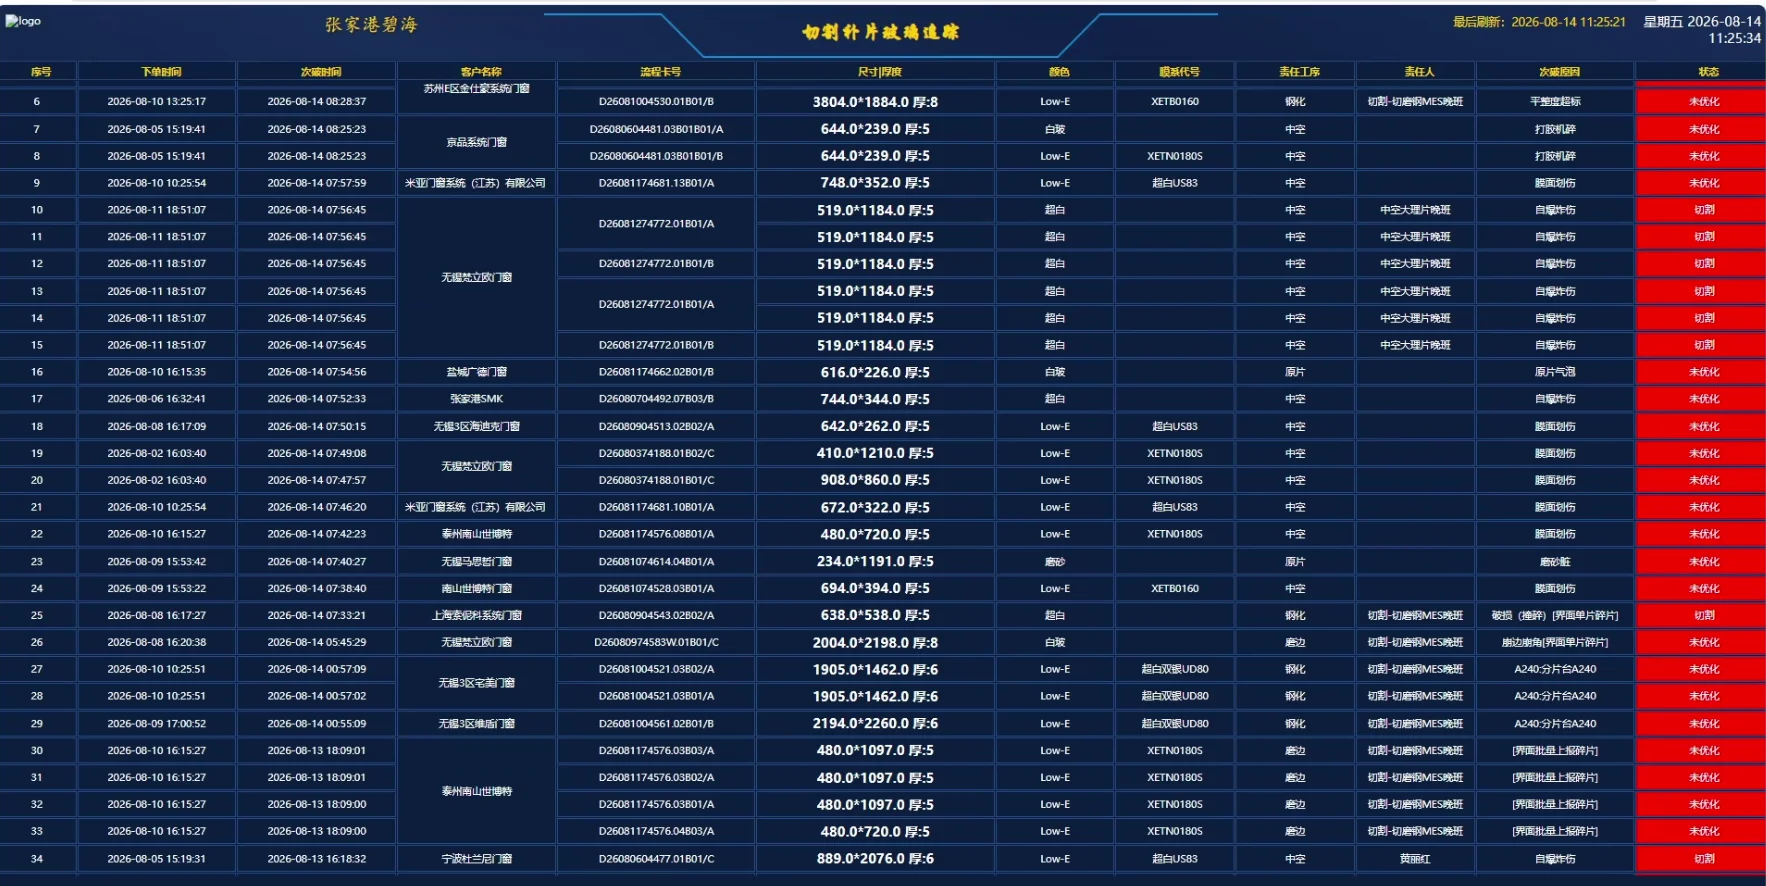
Production managers and lead cutting operators use this dashboard to monitor defect occurrence times and replenishment statuses including unoptimized, optimized, and in-cutting. Completed cutting tasks are automatically removed from the list. A 24-hour overdue alert helps teams prioritize work and improve downstream process matching rates.
- Order Delivery Date Early Warning Dashboard
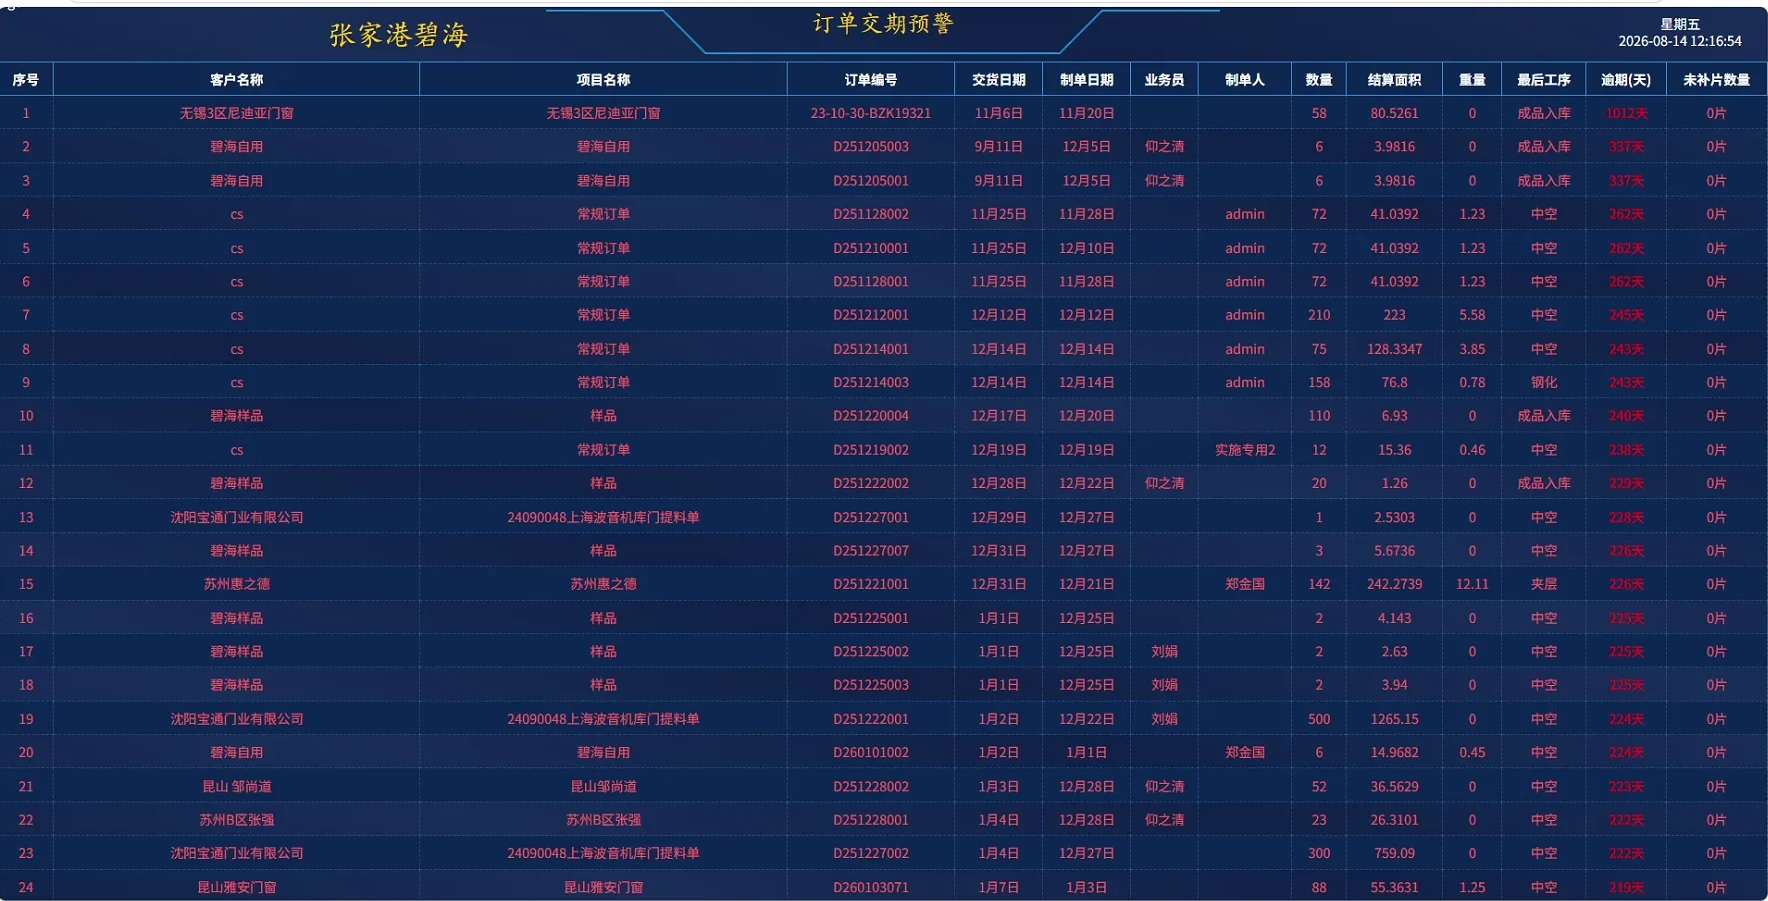
This order fulfillment dashboard automatically aggregates all overdue, partially delivered orders—acting as a real-time “outstanding order list.” It displays customer name, project, order number, order date, agreed delivery date, stalled process stage, days overdue, and outstanding quantity. Orders are sorted by days overdue to prioritize production and accelerate delivery.
- Production & Operations Dashboard
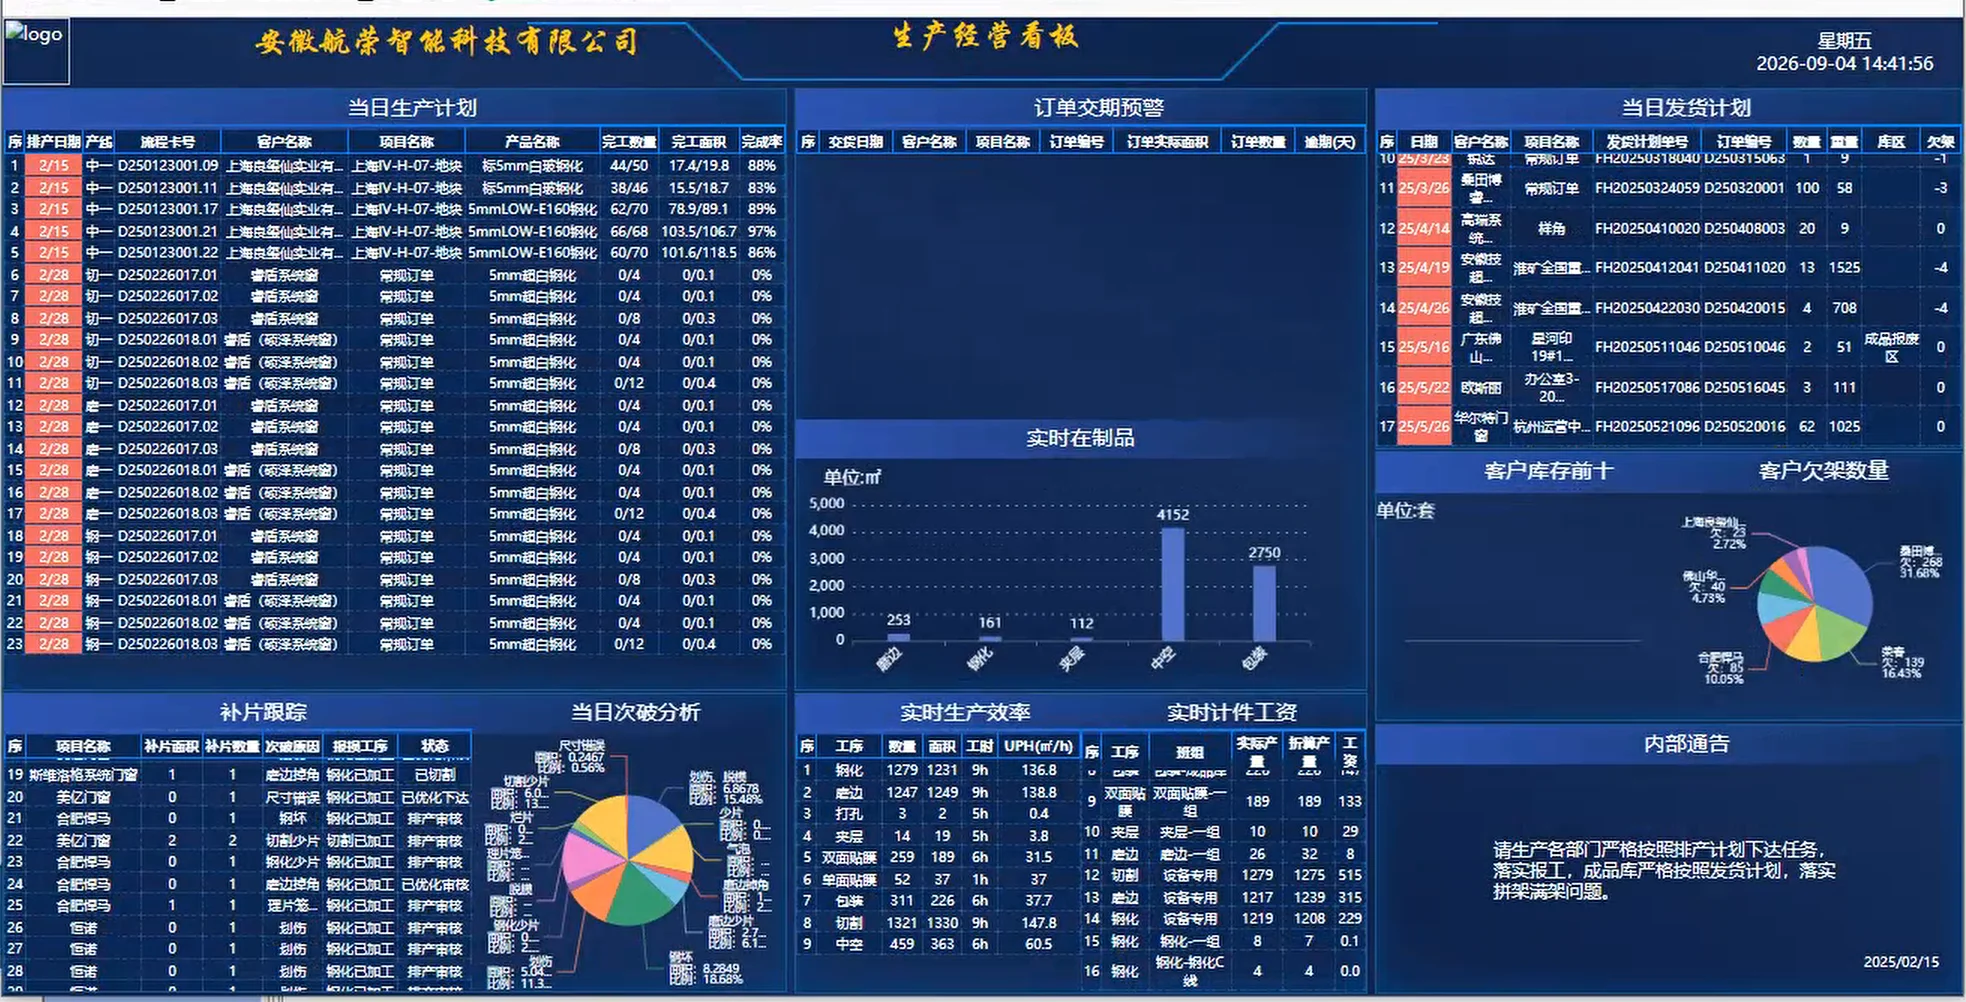
A comprehensive executive production dashboard for senior and site management, integrating production planning, execution, replenishment, inventory, and work-in-progress (WIP) data. Instead of consulting multiple reports, managers gain a single-screen view of global production status to identify shortfalls, bottlenecks, replenishment anomalies, inventory backlogs, and WIP stagnation—enabling real-time resource allocation and a shift from retrospective review to proactive control.
- Production Planning Dashboard
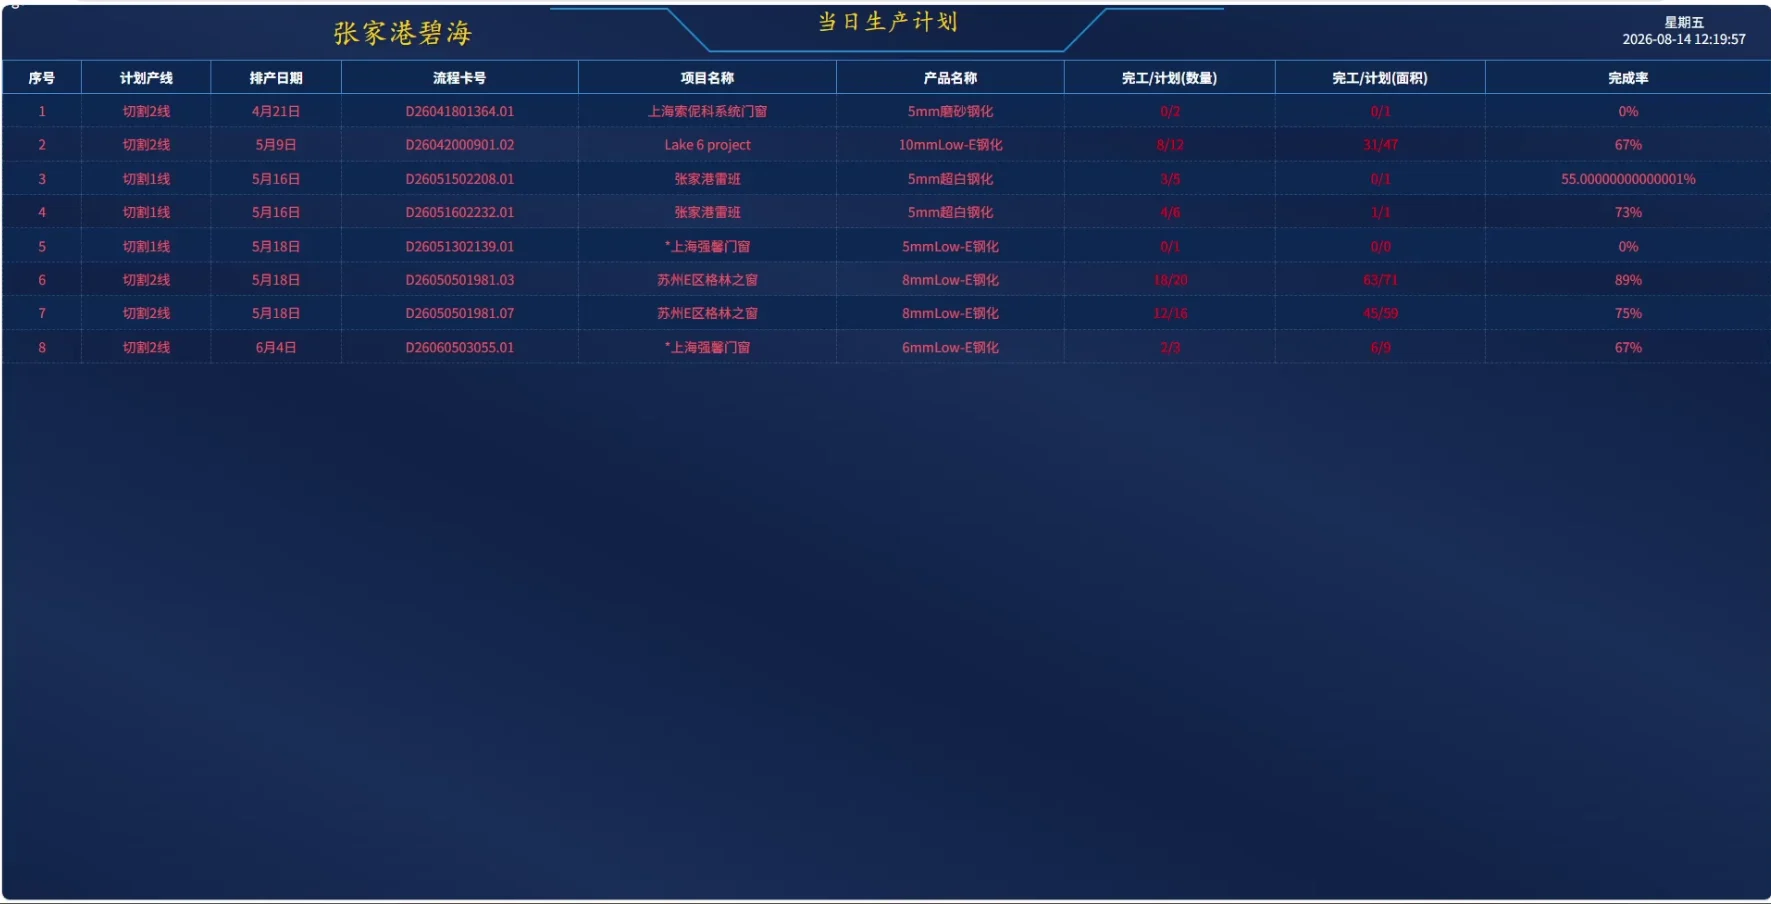
Production planners use the daily production scheduling dashboard to view scheduled tasks and carryover unfinished work, monitor line performance via completion rates, and compare planned output against real-time progress to track order deviations.
Conclusion
Yinrui Software’s smart factory visualization dashboards bridge the historical gap between shop floor execution and ERP business data in glass manufacturing. By delivering real-time, role-specific insights across every production and business process, these tools help glass factories reduce bottlenecks, shorten lead times, improve quality yields, optimize inventory turnover, and achieve sustainable operational efficiency gains.
For glass manufacturers ready to upgrade their production visibility, investing in targeted production management and ERP dashboards is a proven step toward building a truly intelligent, data-driven factory.